
Without a share of voice figure, every rival's good month looks like your bad one. Teams react by posting more, rewriting their tone or cutting the channel, when the real gap might be timing, or might not exist at all.
To increase share of voice on Twitter, you start with a number X does not give you, so you have to build it yourself.
How do you increase share of voice on Twitter?
Measure it first as your own ratio: your monthly impressions or engagement divided by the total for you plus the rivals you name, then raise the part that lags. Circleboom lines up those monthly totals for your X account and up to four rivals on Twitter, with every figure calculated from records pulled through X's official API at Enterprise level.
→ Increase share of voice on Twitter from one dated rival report
What share of voice means on Twitter when X publishes no score
Share of voice is the slice of attention your account holds inside a set of accounts competing for the same audience. X has no share of voice metric, no formula and no dashboard tile for it. Any figure you see is someone's own calculation, and this guide is no exception.
The calculation is simple. Pick the accounts you compete with, take one month, and divide your total by the total of everyone in the set, yourself included.
Which total you divide decides what the share means. That choice is where most attempts to increase share of voice on Twitter go wrong, because one number gets asked to answer two different questions.
The idea sits close to Twitter mindshare, and the two are often used as if they were one thing. The difference that matters here is practical: share of voice is computed from the same fields for every account, so you can repeat it next month and compare.
Before any of the math, the accounts in the set have to be comparable. Choosing them is an audit question in its own right, so this guide assumes you already know your three or four direct peers.
Need a same-date comparison of those peers today? You can measure your share of voice against named rivals in one report and keep the series going from there.
Two ratios that make up your share of voice on X
Your share of voice on X is really two ratios, and they move independently:
- Visibility share: your monthly impressions divided by the monthly impressions of the whole set.
- Conversation share: your monthly engagements (likes, reposts, replies, quotes and bookmarks) divided by the set's total.
Visibility share tells you how often your posts were shown. Conversation share tells you how often people did something with them.
A brand can lead one and trail the other, and the fix for each is different.
The list of key Twitter performance metrics you should track is long. For share of voice, only these two totals and the posting counts behind them matter.
Every share splits into posts times the per-post average
Each monthly total is the number of posts multiplied by the average result per post. That split is the most useful tool you have to increase share of voice on Twitter, because it names the lever.
A rival with a bigger visibility share might simply publish twice as often. Another might post as often as you and get three times the impressions per post.
The first gap closes with a fuller queue. The second needs better posts, better timing or a cleaner audience.
If you cannot tell volume from per-post performance, you will pick the wrong fix.
A worked example with four accounts
Take a set of four accounts over one month, using numbers chosen to show the logic:
| Account | Total impressions | Total engagements | Posts |
|---|---|---|---|
| You | 180,000 | 5,400 | 60 |
| Rival A | 420,000 | 6,300 | 140 |
| Rival B | 260,000 | 5,200 | 90 |
| Rival C | 140,000 | 1,100 | 50 |
The set saw 1,000,000 impressions, so your visibility share is 18 percent. It collected 18,000 engagements, so your conversation share is 30 percent.
That gap between 18 and 30 is the finding. Your posts earn engagement at 3 percent of impressions, double Rival A's 1.5 percent, and your per-post average of 3,000 impressions equals Rival A's.
Rival A leads on volume, not on quality.
So the way to increase share of voice on X here is distribution, not copywriting.
Say you move from 60 to 90 posts a month at the same 3,000 impressions per post, and the others stay flat. Your visibility share rises from 18 percent to about 24.8 percent (270,000 of 1,090,000). That is arithmetic on assumed numbers, not a forecast, but it tells you which project to fund first.
Why a profile-by-profile check misses the real gap on Twitter
Rival profiles show follower counts and the likes on recent posts. They do not show monthly impression totals, engagement totals across all interaction types, or how many posts produced them.
Gathering those numbers by hand also breaks the comparison. You would count one rival's posts in March, another's in April, and screenshot a third on a day their one viral post happened to sit at the top.
A ratio built from mismatched windows cannot be defended. It also cannot be repeated, so you never learn whether the next month's plan worked.
Circleboom pulls the same fields for every account on one date. The data comes in through Circleboom's official X Enterprise developer access, not through scraping, so the numbers hold up when a manager asks where they came from.
With Circleboom you can put your own account beside up to four competitors, or compare up to five accounts without your own, and read monthly totals, per-post averages and posting cadence side by side.
When the gap is clear, you can grow your share of the conversation on X with a plan aimed at the ratio that actually lags.
How to increase share of voice on Twitter with a benchmark report
The method runs in three phases: build a same-date comparison, read the totals that make up your share, then turn the weaker ratio into scheduled posts.
Set up one comparison you can repeat every month
- Log in to Circleboom Twitter with the X account you manage.

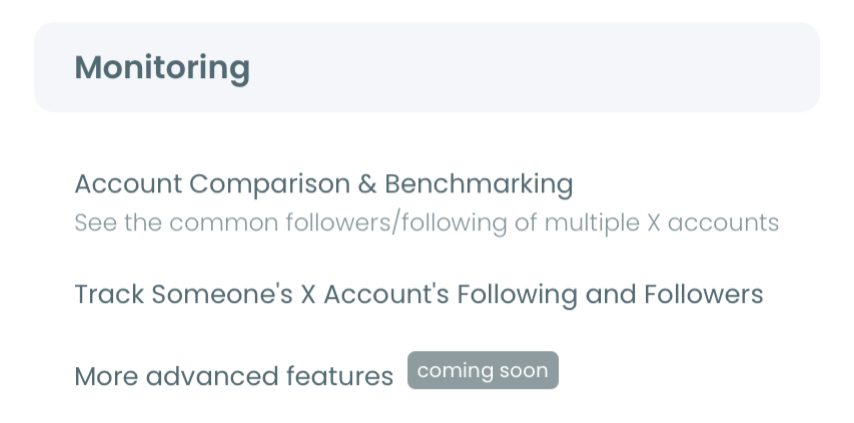
- Open the Monitoring menu and choose X Competitor Analysis & Benchmark Report, the first item in the list.
- Add your own handle in the first slot under Account Handles, then add up to four rivals with the + button. Every account must be public and under 3,000,000 followers.
- Click Start Competitor Analysis and pick Keep it up to date every month, so the same set is measured on the same day each month.
Read the monthly totals behind your share
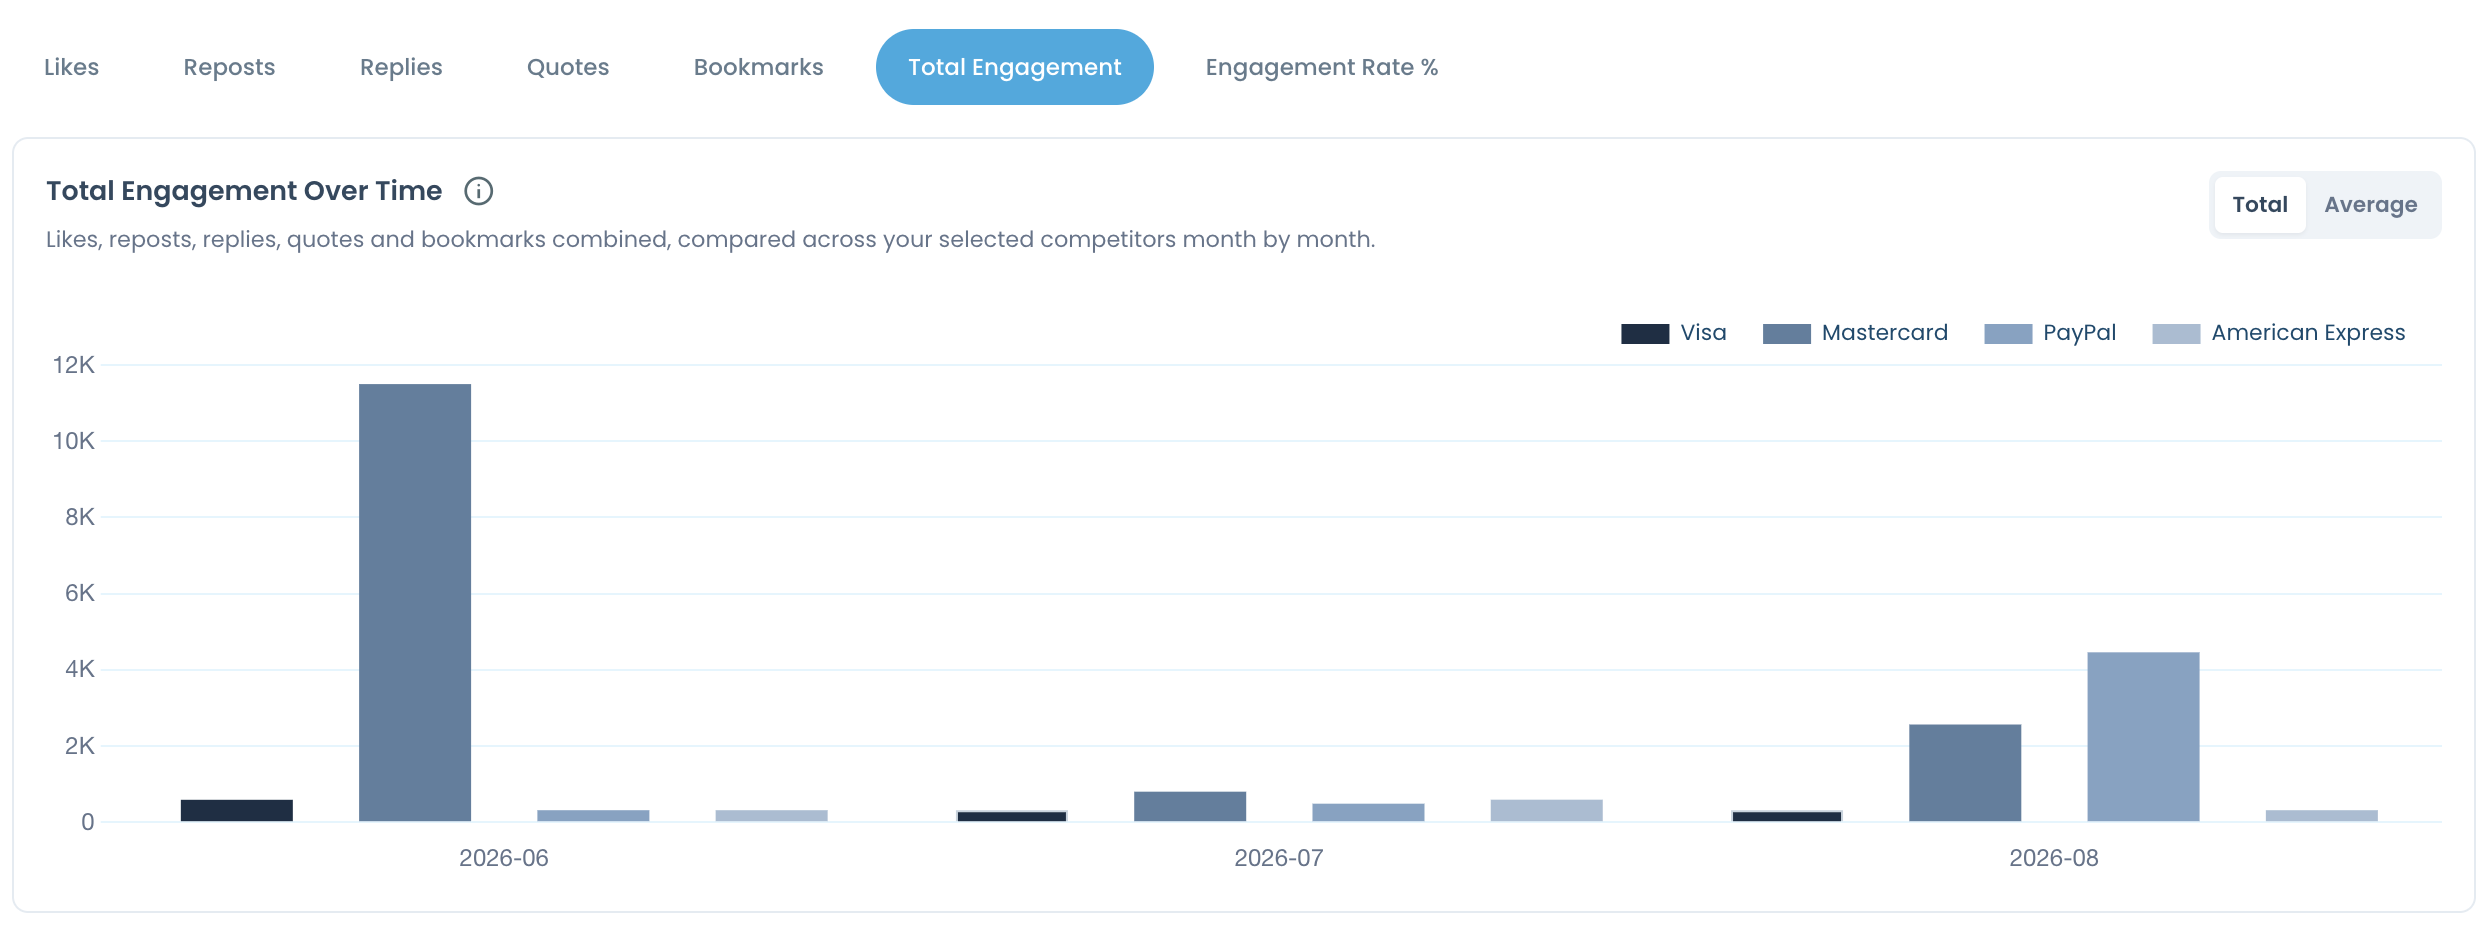
- Open the Engagement section and select the Total Engagement tab of the over-time chart. Note each account's total for the month you are measuring.
- Move to Impression/Views and read the Total impressions overtime chart for the same month.
- Divide your figure by the set's total for each chart. The engagement result is your conversation share; the impressions result is your visibility share.
- Check Posts per day in Posting Behavior and the per-post averages in the Engagement table to see whether the leader wins on volume or on each post.
Turn the weaker ratio into a posting plan
- Rewrite your strongest past posts with the per-post Rewrite with AI button in X Post Analytics, so a proven idea goes out again with a new opening line.
- Schedule the new posts in X Post Planner using Find your best posting time, which offers six suggested slots based on audience activity. Scheduled posts must be set at least 15 minutes ahead.
If you want to increase share of voice on Twitter and keep it, measurement has to come before action. The ratio tells you which lever to pull, the posts-times-average split tells you how hard, and the monthly schedule tells you next month whether it moved.
Which hours give you a bigger share of the Twitter timeline?
The hours your rivals leave empty are the cheapest way to increase share of voice on Twitter. The report shows a Posting time-of-day pattern for every account, an hour-by-day heatmap of when each one actually publishes.
Lay those heatmaps beside the audience active-times heatmap. If your three rivals cluster their posts between 08:00 and 10:00 and your audience is still active at 19:00, the evening slot puts your post in front of the same people with less competition in the moment.
The Posting-vs-audience timing alignment panel overlays your posting curve on when your users are online. It shows overlap as a picture, not a score; the subtitle mentions a score, but no number is printed.
Use the overlay to find the gap, then schedule into it. You can check the hour-by-hour view on its own with best time to post on Twitter before you fill the queue.
Activity is not attention.
Posting when the audience is online improves the odds of being seen; it does not explain a performance gap by itself, so read timing together with the per-post averages.
How resurfacing your best posts lifts visibility share on X
A post that already earned engagement can earn more impressions without being rewritten. Auto Retweet, inside X Post Planner, reposts a tweet on a schedule you set and can remove the repost afterward.
The Auto Repost / Un-RePost panel has three settings:
- RePost after: hours and minutes after the original goes live.
- Un-RePost after: how long the repost stays before it is removed.
- Repeat this cycle: how many times the RePost and Un-RePost pair runs.
With RePost after set to 5 hours, Un-RePost after 1 hour and the cycle repeated 2 times, one post gets its original window plus two more.
That is how resurfacing helps increase share of voice on X: it adds impressions to your monthly total, the visibility side of your share, without adding a single new post.
Choose evergreen posts, not news or time-bound offers.
Keep cycles spaced: reposting the same tweet too often to the same followers can lower engagement per impression, and excessive automated reposting may be flagged as spam-like under X's automation rules. The auto retweeter page shows the setup on its own.
Can you measure share of voice from mentions instead of accounts?
Yes, but that is a different measurement with a different tool. The benchmark report works at account level: it compares what each named account publishes and earns, not every tweet that mentions a brand or a topic.
Mention share answers a broader question, how much of the talk around a keyword or hashtag involves you, including posts by people who do not follow you.
For that, Circleboom's Historical Tweet Search finds past tweets by keyword and Real-time Tweet Search monitors keywords and hashtags as they are posted.
A keyword and hashtag tracker is the natural starting point if your stakeholders define share of voice by conversation around the category rather than by your own posts.
Listen in: how Historical and Real-Time Tweet Search track the keywords, hashtags and competitor conversations around a topic on X.
Most teams need both views. Account-level share tells you how your publishing compares; mention share tells you whether the category is talking about you at all. Keep them as separate numbers in your report so neither gets read as the other.
Raising conversation share once visibility is fixed
When visibility share is level with rivals and conversation share still trails, the problem is the posts, not the schedule.
The report's Content Leaderboards show each account's top 5 tweets by engagement, impressions, replies and bookmarks, and the actual posts are the study material.
Read the reply leaderboard closely. A rival whose most-replied posts ask for opinions is earning conversation share by asking, and the Original / Reply / RT / Quote distribution shows whether replying to others is part of how they grow.
A collection of tips for brands to get better engagement on Twitter is useful here as a checklist of formats to test.
The report's engagement rate is total engagement divided by total impressions, not by followers, so quote it on that basis.
A bigger follower list is not a bigger share either, and a Twitter follower audit shows how much of your own list is still active.
Your share of voice on X, measured and moving
To increase share of voice on Twitter, start from two ratios you calculate from one set of rivals: visibility share from monthly impressions and conversation share from monthly engagements. Split each into posts times the per-post average, and the gap tells you whether to post more, post at other hours, resurface what works or write better posts.
I have found that the teams who keep the same rival set month after month learn faster than the ones who chase a new benchmark every quarter. The monthly schedule exists for exactly that, and scheduling monthly competitor reports takes one extra choice when you start the run.
Circleboom gives you the same fields for every account on one date, a dated history of runs, and X Post Planner to act on what the numbers show.
→ Start growing your Twitter share of voice with a same-date rival report
Share of voice tracking on Twitter: three questions worth settling
How many rival accounts fit in one Circleboom share of voice comparison?
Up to five accounts in total: your own plus four rivals, or five accounts without your own. Competitor Tokens are charged per competitor per report, and your own account never uses a token, so four rivals on a 12-month schedule is 13 reports and 52 tokens.
What if my share of voice drops while my own Twitter numbers stay flat?
Then the rivals grew, or the set changed. Check whether one rival's monthly total jumped on a single post by comparing its total chart with its top tweet, and confirm you compared the same accounts in both months before acting.
Can I calculate Twitter share of voice in a spreadsheet instead?
You can, but each account's numbers must come from the same month and the same fields, which X's public profiles do not give you. A same-date report removes the argument about how each figure was gathered, and it keeps the history so the next month's ratio is comparable.