
A competitor gets more engagement on X usually for one of five reasons: a less diluted audience, more output, a better-fit format, better timing or one post that carries the average.
Treat each one as something to check, because any of them can look like better content from the outside.
From a profile page: follower count, following count and recent likes, with no way to tell the five causes apart. With Circleboom: up to 5 X accounts on one date, in one 9-section report, built through official X (Twitter) Enterprise APIs.
→ Check all five causes of your competitor's engagement lead
Each cause below names the panel that confirms it.
The five causes of a competitor's engagement lead on X
Five causes are worth checking first in an engagement gap between comparable X accounts, and Circleboom's X Competitor Analysis & Benchmark Report tool has a panel for each.
| Cause to check | Panel that checks it | What points to it |
|---|---|---|
| Diluted audience | Audience Quality | Wider inactive and bot shares |
| Volume | Engagement, Posting Behavior | Total lead, level per-post average |
| Format | Content Type & Format | A top format you rarely use |
| Timing | Posting-vs-audience alignment | Posting outside audience activity |
| One-post spike | Top tweet head-to-head | Best post far above the average |
Read that table as a list of checks, and let the data settle each one.
These comparisons show observed relationships, and none of them proves that one tactic caused a result.
Why is this hard to do by eye? Low engagement can come from any of the five, each has a different remedy, and each stays invisible until the others are ruled out.
You can compare what gives a competitor more engagement in one report instead of guessing which cause you are looking at.
What engagement rate means in this comparison
Engagement rate here is total engagement divided by total impressions. It describes how often people who were shown a post interacted with it, and it is never a follower-normalized figure.
That definition changes how you read the gap:
- A higher rate suggests posts connect better with the people who see them.
- More impressions with a level rate suggests a visibility gap, with no sign of a content gap.
- More total engagement with a level rate suggests more output or more reach.
Two accounts can earn 1,000 engagements each, one from 20,000 impressions at 5% and one from 100,000 at 1%. Those are different situations with the same total, and the total alone hides the difference.
I treat that rate as a filter, because it helps decide which cause to open next.
Figures in the report are calculated from official X API records, and Circleboom is an official X Enterprise Developer. That keeps the basis the same for every account, which a hand count cannot do.
The sample report on public accounts shows the layout with Visa, Mastercard, PayPal and American Express. Its numbers show patterns, not current facts about those companies.
Do they get more engagement on X, or do they just post more?
Often they just post more, and per-post averages settle it.
Every interaction column in the Engagement summary is a per-post average, while period totals appear only in the over-time charts.
Compare these two accounts, using round numbers for illustration:
- Account A: 12,000 engagements from 400 posts, or 30 per post.
- Account B: 6,000 engagements from 100 posts, or 60 per post.
Account A leads the monthly chart by two to one. Account B earns twice as much from each post.
Higher total engagement with lower engagement per post is a volume lead, and closing it costs something very different from fixing a content gap.
Greater output may explain the total, so inspect comparable periods before you recommend more posting.
Two details make this read safer. The cadence panel prints Lifetime Average next to Last 30 Days Average, so you can see whether a rival's output changed recently.
The consistency panel labels each account Steady or Burst with a CV number, and bursts may simply reflect events or campaigns.
Could inactive and bot followers be holding your engagement down?
They could, and Audience Quality is the panel that checks it.
It shows Human vs Fake/Bot, Active vs Inactive, Ordinary vs Overactive and High, Medium and Low quality tiers for every account in the set.
This cause matters because of how the report itself explains distribution: X first shows a new post to a small test group of followers, and fast engagement grows reach while no engagement slows it.
Followers who stopped posting years ago may be part of that group.
A follower count hides this. Compare both accounts on active followers:
| Account | Followers | Active share | Active followers |
|---|---|---|---|
| Competitor | 50,000 | 60% | 30,000 |
| You | 35,000 | 85% | 29,750 |
On that basis, the two audiences are nearly even.
The sample report shows how far this can go. Its largest account, at 1.1M followers, carried 34% suspected bot accounts and 63% inactive accounts, and the smallest High tier in the set at 2%.
For your own account, a good next read is why your followers are not engaging on Twitter. After that, review the accounts in the low-quality followers and friends view.
Two cautions apply. The active share measures posting activity, and a person who rarely posts may still read everything.
So treat flags as review signals and make cleanup a slow, confirmed step, as the guide on how to remove Twitter followers who don't engage lays out.
Nothing here guarantees reach.
Are you posting at the wrong time compared to them?
You may be, and the Posting-vs-audience timing alignment panel checks it by overlaying your posting times on when your users are online.
Closer curves mean more overlap. The panel prints no numeric score, so read the visual gap.
Start with the time-of-day pattern, an hour-by-day map of when each account publishes.
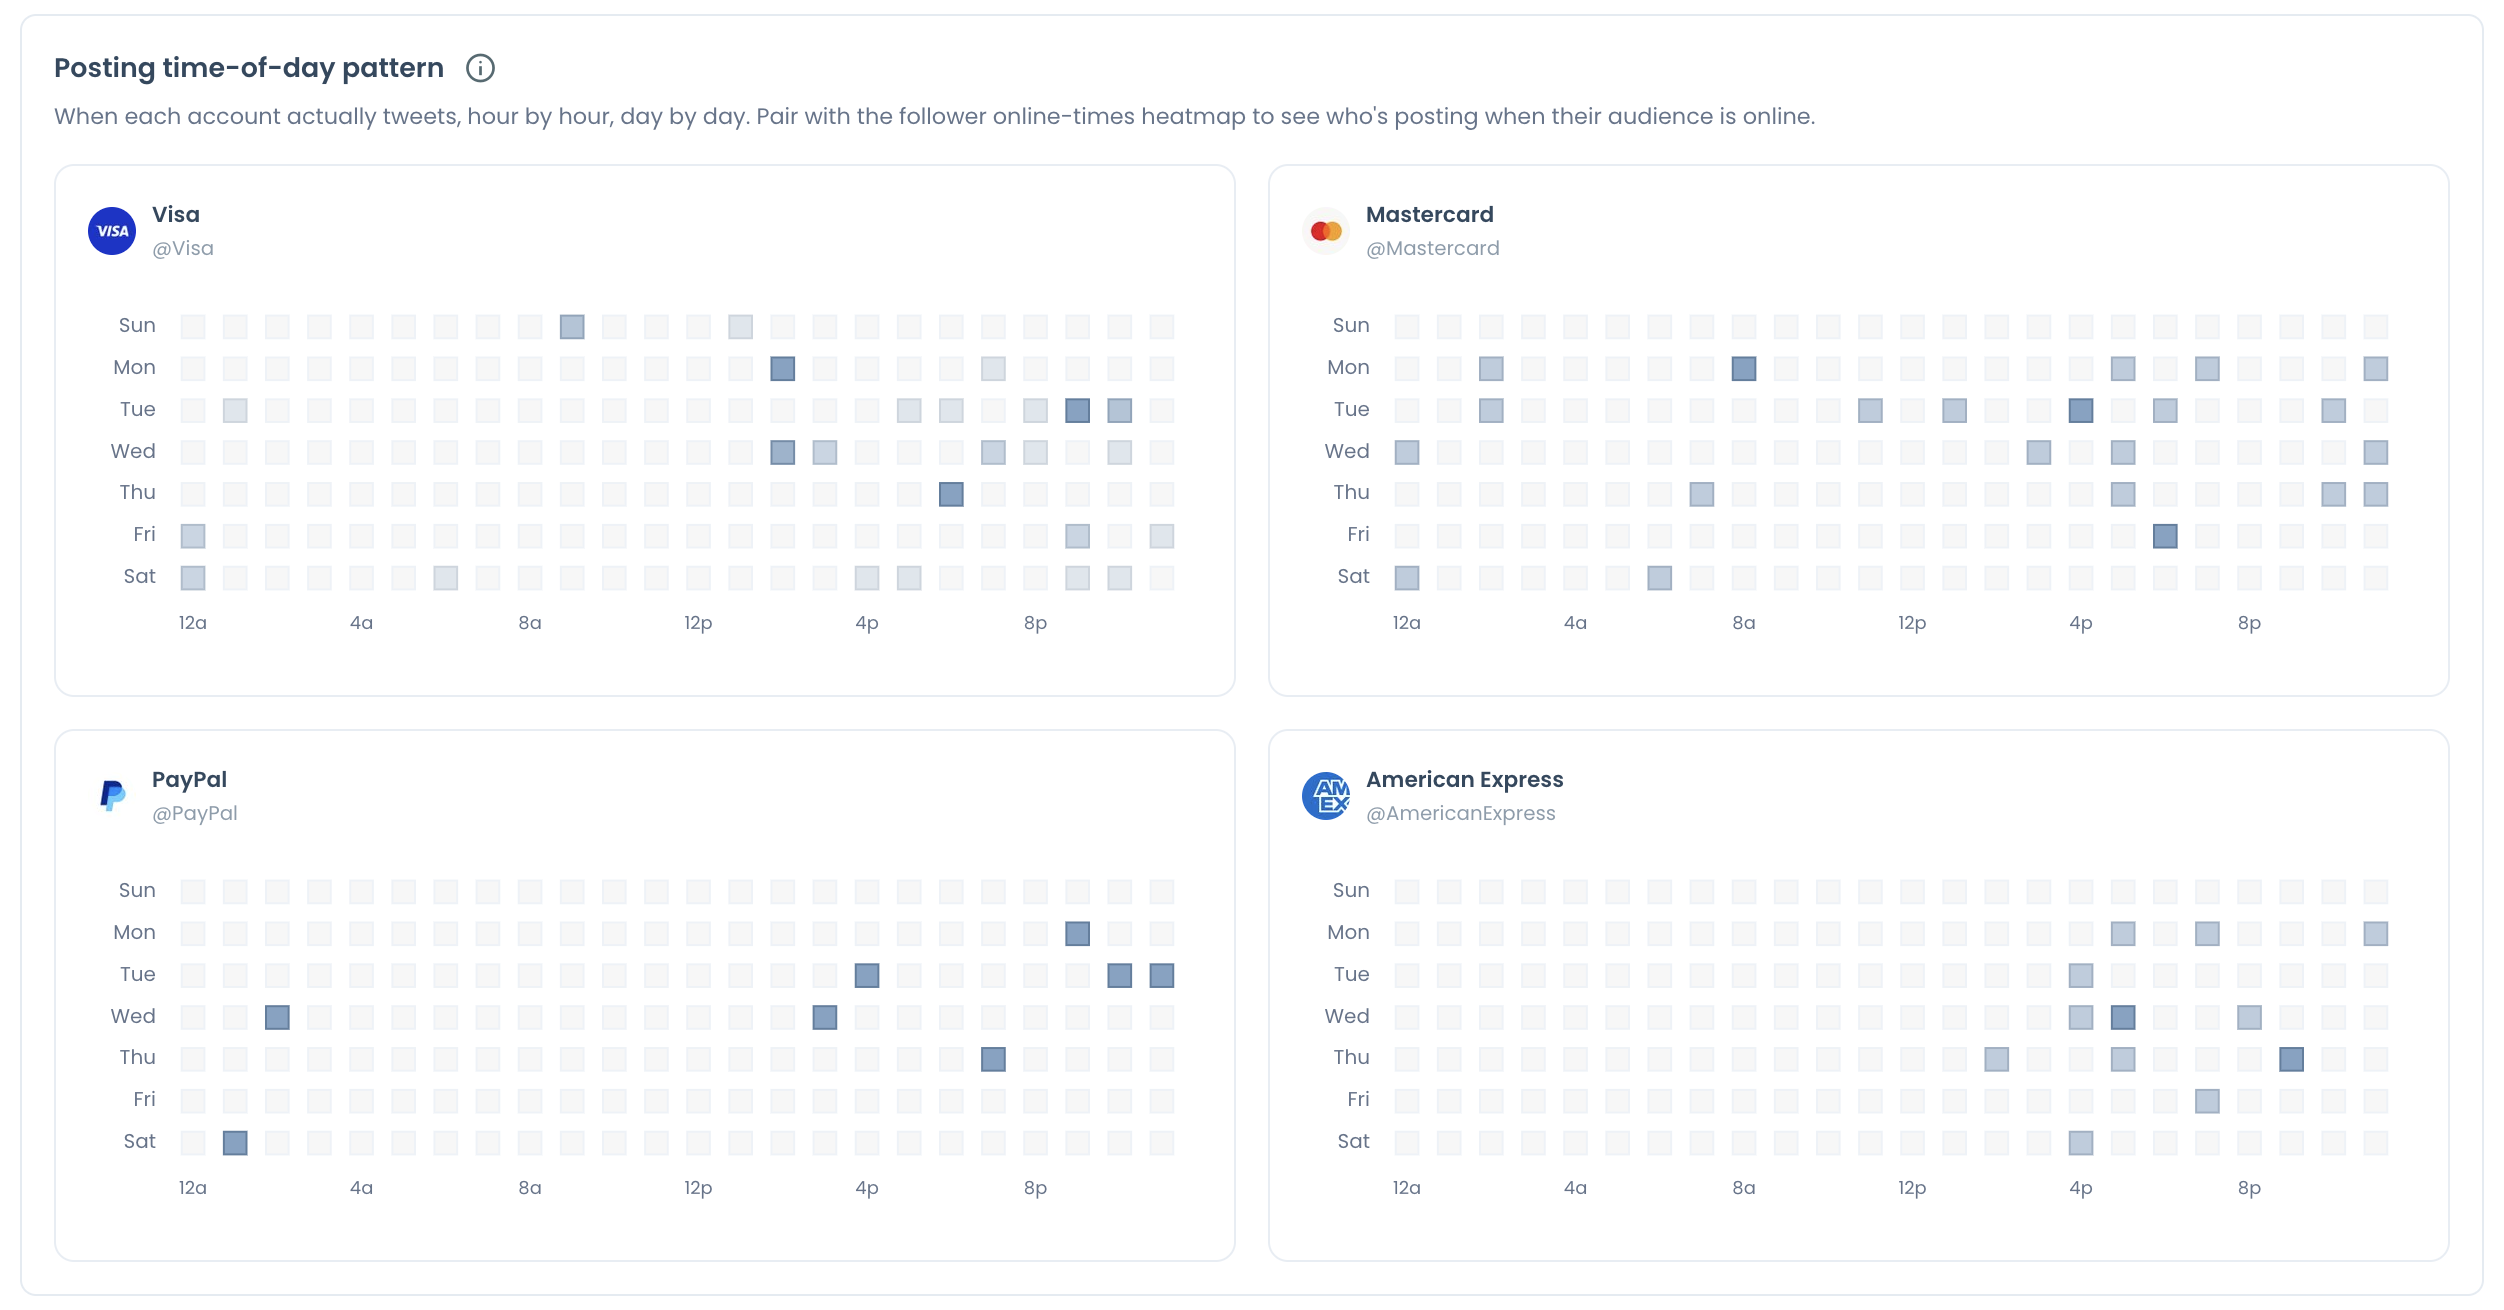
A rival's map shows its habit, not your audience's.
For your own list, the best time to post on Twitter is the detailed view. The guide on how to determine your best time to post on Twitter covers how to read it.
Read both maps in the same time-zone band before you trust a gap.
Timing is a scheduling signal, so it can explain missed visibility without explaining why people who saw a post did not respond.
Why the peer set decides whether the gap means anything on X
An engagement gap only means something against a comparable account. Direct peers share your target market, language, scale, publishing purpose and business model, and those are the accounts that measure performance.
Category leaders are useful for studying approaches, but their totals make poor targets.
A larger account in a different market may be a fair reference and still a weak benchmark.
Keep the set stable across runs too, since swapping an account changes the group, and a changed group is not a change in your position.
So compare your account with direct peers to test a competitor's engagement lead before you read anything into the gap.
The same discipline applies inside the report. Higher impressions with weaker interaction is a different finding from a lower rate on similar impressions, so open the posts behind the numbers before you decide whether the gap concerns topic, presentation or audience relevance.
Format and one-post spikes: how to read the last two causes
These two causes need less explaining and more looking, and they sit in separate parts of the report.
Format is a two-panel check. Post Format Distribution shows how each account splits its output across text, image, video and poll, and Top-performing format shows which one earns its highest engagement rate.
A format that takes most of the effort but never appears among an account's leaders tells you something, in your account or in theirs.
One-post spikes take one cross-read. Set the top tweet head-to-head beside the per-post average, then look at the monthly engagement chart.
A single month lifting the whole series while the average stays flat points to an outlier rather than a strategy shift.
If none of the five explains a sudden collapse, the Twitter shadowban test is a quick separate check.
How to find why a competitor gets more engagement on X
To find why a competitor gets more engagement on X, pull your account and your peers on one date, then read one panel per cause. Audience comes first because it can change how you read everything after it. The flow below has three phases.
Log in and open the Monitoring menu
- Log in to Circleboom Twitter and connect your X account.

- Open the Monitoring menu and select the X Competitor Benchmark Report.
Add the accounts you want to check
- Enter up to 5 handles under Account Handles: your own plus up to 4 competitors, using direct peers in your market, language and scale.
- Select Start Competitor Analysis, then choose Just this once or Keep it up to date every month. A 12-month schedule produces 13 reports, and Competitor Tokens are charged per competitor per report.
Read one panel per cause
- Read Audience Quality, cadence and per-post averages, format panels, the timing overlay and the head-to-head, in that order, and mark each cause as confirmed, ruled out or unclear.
That order holds up because each check removes a cheaper explanation first, and a marked list keeps you from acting on the last chart you looked at.
At a glance: pull one date, read one panel per cause, act on one gap.
Only public accounts can be compared, accounts above 3,000,000 followers cannot be analyzed, and each pull covers up to about 3,200 recent posts per account.
Check the post dates before you compare, since the same post count can span a shorter period for a frequent publisher.
Summary: five causes, one check at a time
A competitor's engagement lead on X usually traces to audience, volume, format, timing or a single post. The panels above let you check each one on a single date, and the result is a list of what to look at next.
Reading it this way protects you from funding a fix for a gap you do not have.
Circleboom gives you that comparison without scraping, and a saved run gives you something to measure the next one against.
→ Run the benchmark and test each cause of a competitor's engagement lead
FAQ on engagement gaps between X accounts
Can a single viral tweet skew a competitor's average on X?
It can, and in the sample report one account averaged 13.9 engagements per post while its single best post reached 536. Circleboom's head-to-head panel puts that best post next to the average for every X account in the set.
Which gap should I close first on X?
Change the largest gap you can afford to close. A timing or volume gap goes to X Post Planner, while an audience gap starts with a review.
Clearing weak history is a separate decision, covered in how to delete old tweets to increase reach.
Is my competitor's most-used format on X worth copying?
Not on format share alone, because what an account posts most may not be what performs best for it. In the sample report, the account with the heaviest media share, 87.5%, had the lowest engagement rate in the set, 0.39%.
A small test in your own voice risks far less than a full switch.
Can I compare engagement rates on X across different tools?
Tools use different bases, so their rates are not interchangeable. The benchmark report divides by impressions, and the Twitter tweet engagement calculator divides by followers, so read each rate only against others built the same way.
Does a high reply count on Twitter mean the posts are liked?
No, a high reply count shows conversation volume, which can include questions, criticism, support or spam. Read the replies in the Top 5 tweets by replies panel before you treat the volume as approval.