Pew Research Center counts 84% of U.S. adults on YouTube and 70% on Facebook, which means your audience is spread across several platforms at once. Social media analytics is how you find out which of those platforms is paying you back, and which numbers prove it.
Which social media analytics numbers are worth tracking in 2026?
Track reach and impressions, the engagement signal each platform values most, and the clicks your links send to your website. Circleboom Publish shows best posting times, audience data and per-post performance for Instagram, Facebook, LinkedIn, X and six more platforms, and its UTM Link Builder tags every link so Google Analytics shows which post brought the visit.
→ Track social media analytics for every post you publish
What social media analytics measures
Social media analytics measures three things about a post: whether people saw it, whether they reacted to it, and whether they did something after it. Most dashboards cover the first two well. The third, what happens after the click, usually lives somewhere else.
The first layer is reach and impressions. Reach counts the accounts that saw a post, and impressions count the times it was shown, so one person scrolling past twice adds two impressions and one reach.
If the two terms still blur together, the breakdown of Instagram reach vs impressions explains the difference with Instagram's own wording.
The second layer is engagement: likes, comments, shares, saves, reactions and watch time. The third layer is action: a click to your website, a signup, a sale.
A post can win the first two layers and lose the third.
That is the gap most metric lists skip. Pew's social media fact sheet shows how many platforms one audience uses, and each of them reports the first two layers in its own way.
Before you compare them, it helps to see the social media analytics behind each platform in one place, instead of opening ten native dashboards.
The numbers worth tracking, grouped by the question they answer
Track a number only when it answers a question you will act on. Grouped that way, the useful social media analytics fit on one short list:
- Was it seen? Reach and impressions, read per post and per period.
- Did it land? The engagement signal that counts most on that platform.
- Did they stay? Video retention, from the first second to the last.
- Who is it reaching? Audience growth, location, language and interests.
- Did it pay off? Clicks, visits and conversions from a tagged link.
Each line maps to a decision. Weak reach points to timing or format. Weak engagement points to the content itself. Strong engagement with no clicks points to the link, the offer or the landing page.
Totals tell you how big an account is; the change from one period to the next tells you whether it is working.
That is why a single month of numbers says little. Compare each period with the one before it, and read the movement, not the size.
Choosing the lead number for your goal
Your goal decides which line leads. A new account trying to get noticed reads reach first.
A brand building trust reads saves, shares and comments first. A shop selling through social media reads tagged clicks and conversions first, and treats the other lines as early warnings.
Pick one lead number per platform, write it down, and judge every post against it for a full quarter before you switch.
Vanity numbers are the ones that answer no question on this list. Total follower count, lifetime likes and a single viral post all look good in a report and change no decision.
Why the same metric means different things on each platform
Engagement is not one number across networks. Each platform rewards a different behavior, so the signal worth watching changes with the platform:
| Platform | Strongest signal | What it tells you |
|---|---|---|
| Saves and shares | The post was worth keeping or sending | |
| Reactions (Like to Angry) | How people felt, all counted as engagement | |
| Profile vs Company Page | Two audiences, read separately | |
| YouTube | Watch time | Whether viewers stayed, not just clicked |
| Saves and outbound clicks | Pins people keep and follow out | |
| Google Business Profile | Calls and direction requests | Searchers who acted on the listing |
Engagement tells you a post was seen; a UTM-tagged click tells you it paid off.
Reading Instagram, Facebook, LinkedIn and X numbers
Instagram saves and shares deserve extra weight. A save means someone bookmarked the post to come back to it, and a share means they sent it to someone in a DM.
A carousel with fewer views but more saves is often the stronger post.
Facebook counts all seven reactions as engagement: Like, Love, Care, Haha, Wow, Sad and Angry. Read the mix as well as the total: a post full of Angry reactions has high engagement and a problem.
LinkedIn splits into a personal Profile and a Company Page, and they are separate audiences. A founder's Profile post and the same post on the Page are two results, never one average.
On X, impressions and engagements sit side by side, and the gap between them is the story. The guide to key Twitter performance metrics you should track shows how to read them together.
YouTube and Google Business Profile read differently
YouTube has a Subscribers-only model with no Following side, and watch time sits at the center of its numbers. Google's own YouTube Analytics overview groups the reports into Reach, Engagement and Audience tabs, with watch time and average view duration under Engagement.
For the reach side of a channel, the explainer on impressions on YouTube covers how a thumbnail earns its views.
Google Business Profile has no followers graph at all. Its value shows up when searchers call the business or ask for directions, so that is where its posts are judged.
If your mix of photos, video and carousels has not changed in a while, read the comparison of how visual content types impact engagement. Format matters on every platform.
How Circleboom Publish reads social media analytics on every platform
Circleboom Publish gives every platform it supports the same three-part analytics view: Best Time to Post, Audience Analytics and Content Performance Analytics. The layout stays the same from Instagram to Pinterest, and only the platform's own metrics change, so you learn one screen instead of ten.
Content Performance Analytics is where a post's numbers live. It has three parts:
- Overview and Graphs: a 7D, 2W, 4W, 3M or 1Y range (or a custom one), two metrics charted at once, and the percentage change against the previous period.
- Post Engagement Analytics: a sortable table of every published post, ranked by any metric.
- Video Analytics: a retention funnel from Started through 25%, 50%, 75% and 100% Watched.
We would read the period-over-period change first, because it answers "is this working?" without a spreadsheet. When you want to measure engagement and impressions per post across every account, the table sorts each platform by the signal that matters there.
Audience data and X analytics in Circleboom Publish
Audience Analytics adds the people behind the numbers: follower growth, characteristics, a map, language and gender stats, and an interest cloud. Two accounts with the same reach can have very different audiences, and this view shows which one matches your buyers.
Read it before you judge a quiet month. If follower growth comes from a country or a language you do not sell to, falling engagement may simply mean the new followers are the wrong people.
The interest cloud is the quickest check: when its top topics match your product, your content is reaching the right crowd.
X works the same way inside Circleboom Publish, because its audience and content analytics are the same Circleboom analytics that power Circleboom Twitter. Circleboom is an official X Enterprise Developer, so the X numbers come through approved access, not scraping.
If X is your main channel, the full Twitter post analytics suite goes deeper on impressions, engagement and video.
Did my numbers drop because of the timing?
Often, yes. A post that goes out while its followers are offline loses reach before anyone judges the content. Check timing before you rewrite anything.
Circleboom's Best Time to Post reads the connected account's own followers, when they are online and engaging, instead of a generic industry chart. The suggestions appear as "Pick your best post time" in the Schedule modal of every composer, on all ten platforms, including Google Business Profile without a follower graph.
Two accounts in the same industry can have very different best times, which is why a chart averaged across millions of accounts often misses. The page on the best time to post on Instagram shows how those suggestions are built for an Instagram account.
When engagement drops in a month, run two checks in order:
- Compare posting times with the suggested times. Posts sent at random hours are the first suspects.
- Compare this month's top posts with last month's in Content Performance Analytics, to see which format slipped.
If timing was on target and one format fell, the content is the variable to change.
What to do with your best-performing posts
Put them back in front of people. Much of today's audience likely never saw a given post the first time, and every new follower joined after it came and went.
A proven post is a lower-risk choice than a brand-new idea on a day with nothing fresh ready.
The order matters. Sort Post Engagement Analytics by the platform's strongest signal, shortlist the posts with real impressions and engagement behind them, then resend one with Repost From Sent Items.
Refresh a hook, a number or the image first so it reads as current. The social media reposting workflow covers the full loop.
For a post that has not proven itself yet, test it instead. Duplicate it, change exactly one variable in the copy (the hook, the image or the posting time), publish both, and read the winner in Content Performance Analytics.
Analytics picks the post; reposting and testing turn the pick into more reach.
Do likes show whether a post brought in sales?
No. A like or an impression says a post was seen; it says nothing about whether anyone clicked the link in it, or whether that click became a signup or a sale.
Without tags, that traffic lands in Google Analytics as generic "social" or "referral," with no way to trace it to a platform or a post.
UTM tags close the gap. Google's guide to URL builders and campaign data says to always use utm_source, utm_medium and utm_campaign, and the values then appear in the Traffic acquisition report.
Tagging links in the Circleboom Publish composer
Circleboom Publish builds the tags inside the composer. Paste a link, click the link icon next to it, and fill in Source, Medium, Name and, if you want, Content.
The tagged URL replaces the original link in the post, so you never leave the window to build it somewhere else.
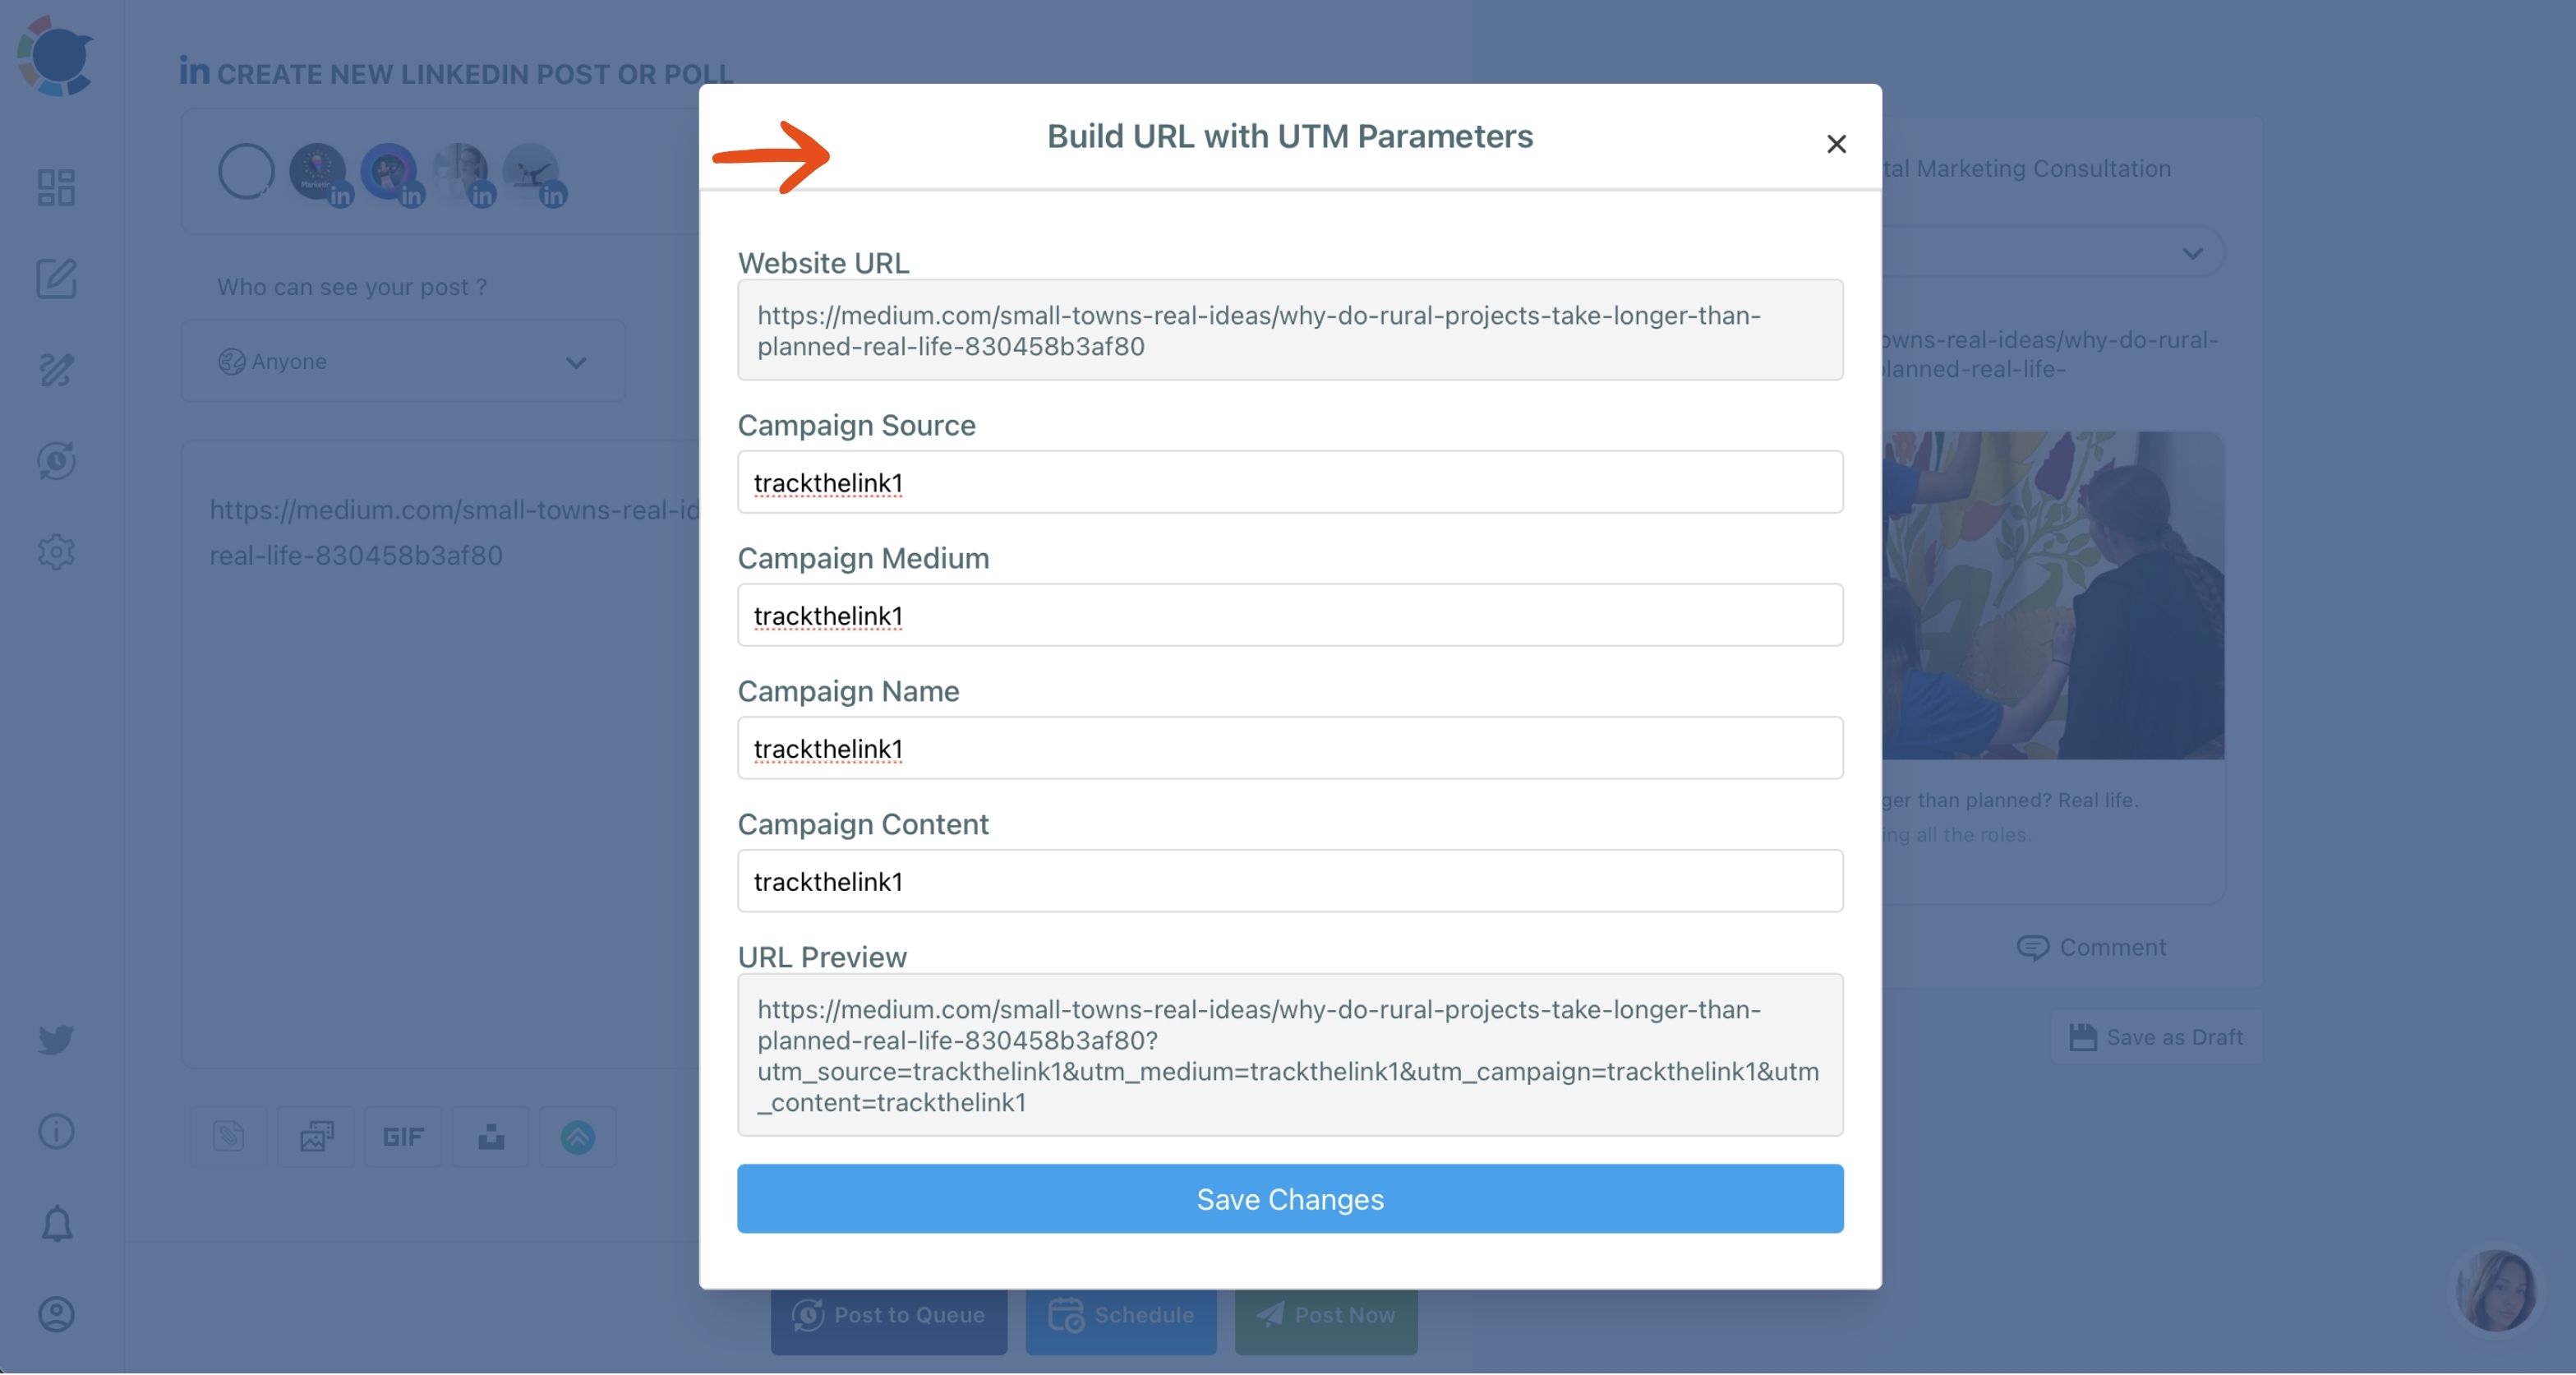
Use one campaign name for one promotion and a different source for each platform. Then the report splits a launch week by platform, and you see which audience clicks, not just which one has the most followers.
The Content field earns its place in tests. When you duplicate a post to compare two hooks, give each version its own Content value.
The like count tells you which hook people enjoyed, and the click data tells you which one sent visitors to your site. Those two answers often disagree, and the second one is the one your budget depends on.
The click data shows up in Google Analytics, not inside Circleboom. The two views work as a pair: Content Performance Analytics shows what happened on the platform, and Google Analytics shows what happened after the click.
How to read your social media analytics each month
A monthly review of social media analytics takes four checks: timing, the platform's strongest signal, video retention and tagged traffic. Run them in that order, because each one rules out a cause before the next. The routine below works for any mix of platforms.
Short demo: reading tweet impressions next to engagements, the attention-versus-action split this routine applies to every platform.
- Check posting times against each account's suggested best times, and flag posts that went out at random hours.
- Sort the post table on each platform by its strongest signal (saves on Instagram, reactions on Facebook, watch time on YouTube).
- Open Video Analytics for your Reels and videos, and note where viewers drop between 25% and 75%.
- Compare tagged traffic in Google Analytics by source, to see which platform sent the visits and conversions.
That order keeps you from fixing the wrong thing. Timing is checked before content, content before format, and the click data last, because it judges everything above it. At a glance: timing, signal, retention, clicks.
If your team reports Facebook numbers in a shared dashboard, the walkthrough to connect Facebook Page Insights to Looker Studio adds that platform to the report.
Summary: the social media analytics worth keeping in your report
The numbers worth tracking are few. Reach shows a post was seen, the platform's strongest signal shows it landed, retention shows people stayed, and a UTM-tagged click shows it paid off.
Read each platform by its own signal, compare periods instead of totals, check timing before content, and let the winners feed your next posts. Circleboom Publish keeps that reading in one place for Instagram, Facebook, LinkedIn, X, YouTube, Pinterest, Google Business Profile and the rest.
→ Review your post analytics across platforms
Common questions about social media analytics
My reach fell overnight on one platform, so what should I check first?
Check for a shadowban before you change your strategy. A sharp, unexplained drop on one platform while the others hold steady can signal one, and Circleboom's checker guide for that platform tells you how to confirm it.
Can I add UTM tags to a link I already posted?
No. A link's tracking data only exists if it was tagged before it was shared, so tag every outbound link in the Circleboom Publish composer before the post goes out.
Does Circleboom Publish show UTM clicks in its own analytics?
No. UTM clicks, traffic and conversions show up in Google Analytics, while Circleboom Publish shows on-platform engagement, impressions and video retention for each post.