
Your follower quality is worse than a competitor's when your High tier share is smaller and your Low tier share is larger than theirs on the same date, with each share read next to the raw account count behind it. A profile page cannot show either figure, so the answer needs a side-by-side report.
Follower quality is a comparison, so check it against named rivals on one date. Circleboom's X Competitor Benchmark Report sorts each compared X account's followers into High, Medium and Low quality tiers using official X Enterprise API records, for up to 5 accounts in one view.
→ Twitter follower quality
The reading order below decides whether a gap is real or only looks that way.
Most write-ups on Twitter follower quality audit one account alone. That produces a number with nothing beside it, and a number with nothing beside it cannot be called good or bad.
The usual trigger is a rival's follower count quoted as proof that they are ahead. Count is the one figure everyone can see, and it is also the figure that says least about who is listening.
With Circleboom, you can benchmark Twitter follower quality for your account and up to 4 competitors on X, with every account measured the same way. Circleboom also covers the wider task of a Twitter followers comparison between accounts on its blog.
How to tell if your X follower quality is worse: three checks in order
Read the report in a fixed order: tier split first, share against raw count second, follower count last. The order matters because each check corrects a mistake the previous number invites.
This sequence follows the path the report's own documentation gives for the question "is their audience real?" I use it because it puts the most misleading figure at the end, after its context is known.
Check the tier split before anything else
The Quality tiers chart is the first stop. It shows, for every compared account, what share of followers falls into the High, Medium and Low tiers.
Tiers are built from three signals together:
- Activity, meaning how regularly the follower posts.
- The follower-to-following ratio of that follower.
- The age of the follower's account.
Because the tiers combine all three, they catch what any single share misses. An account can look fine on suspected bot share alone and still have a thin High tier.
One detail changes how the activity input should be read. Circleboom classifies activity from a follower's average posting frequency, not from the date of the last post. A follower who posted once last week after a silent year is still a low-activity account.
Read each share against its raw count
A percentage hides the size of the list behind it. A smaller share of a bigger list is often more accounts.
The report's Percentage / Values toggle switches the charts between the two readings, and the drill-down rows print both at once, in the form of a share next to a number of accounts. Read the two together before calling any tier better or worse.
The correction usually runs in one direction. The larger account's weak-looking share turns out to be a large number of accounts, and the smaller account's strong-looking share turns out to be a modest one. Both statements are true at once, and a fair reading reports both.
Read the follower count last
The essentials table at the top of the report lists followers, following, active followers, account age, engagement rate and average impressions for each account. Go back to it only after the tiers.
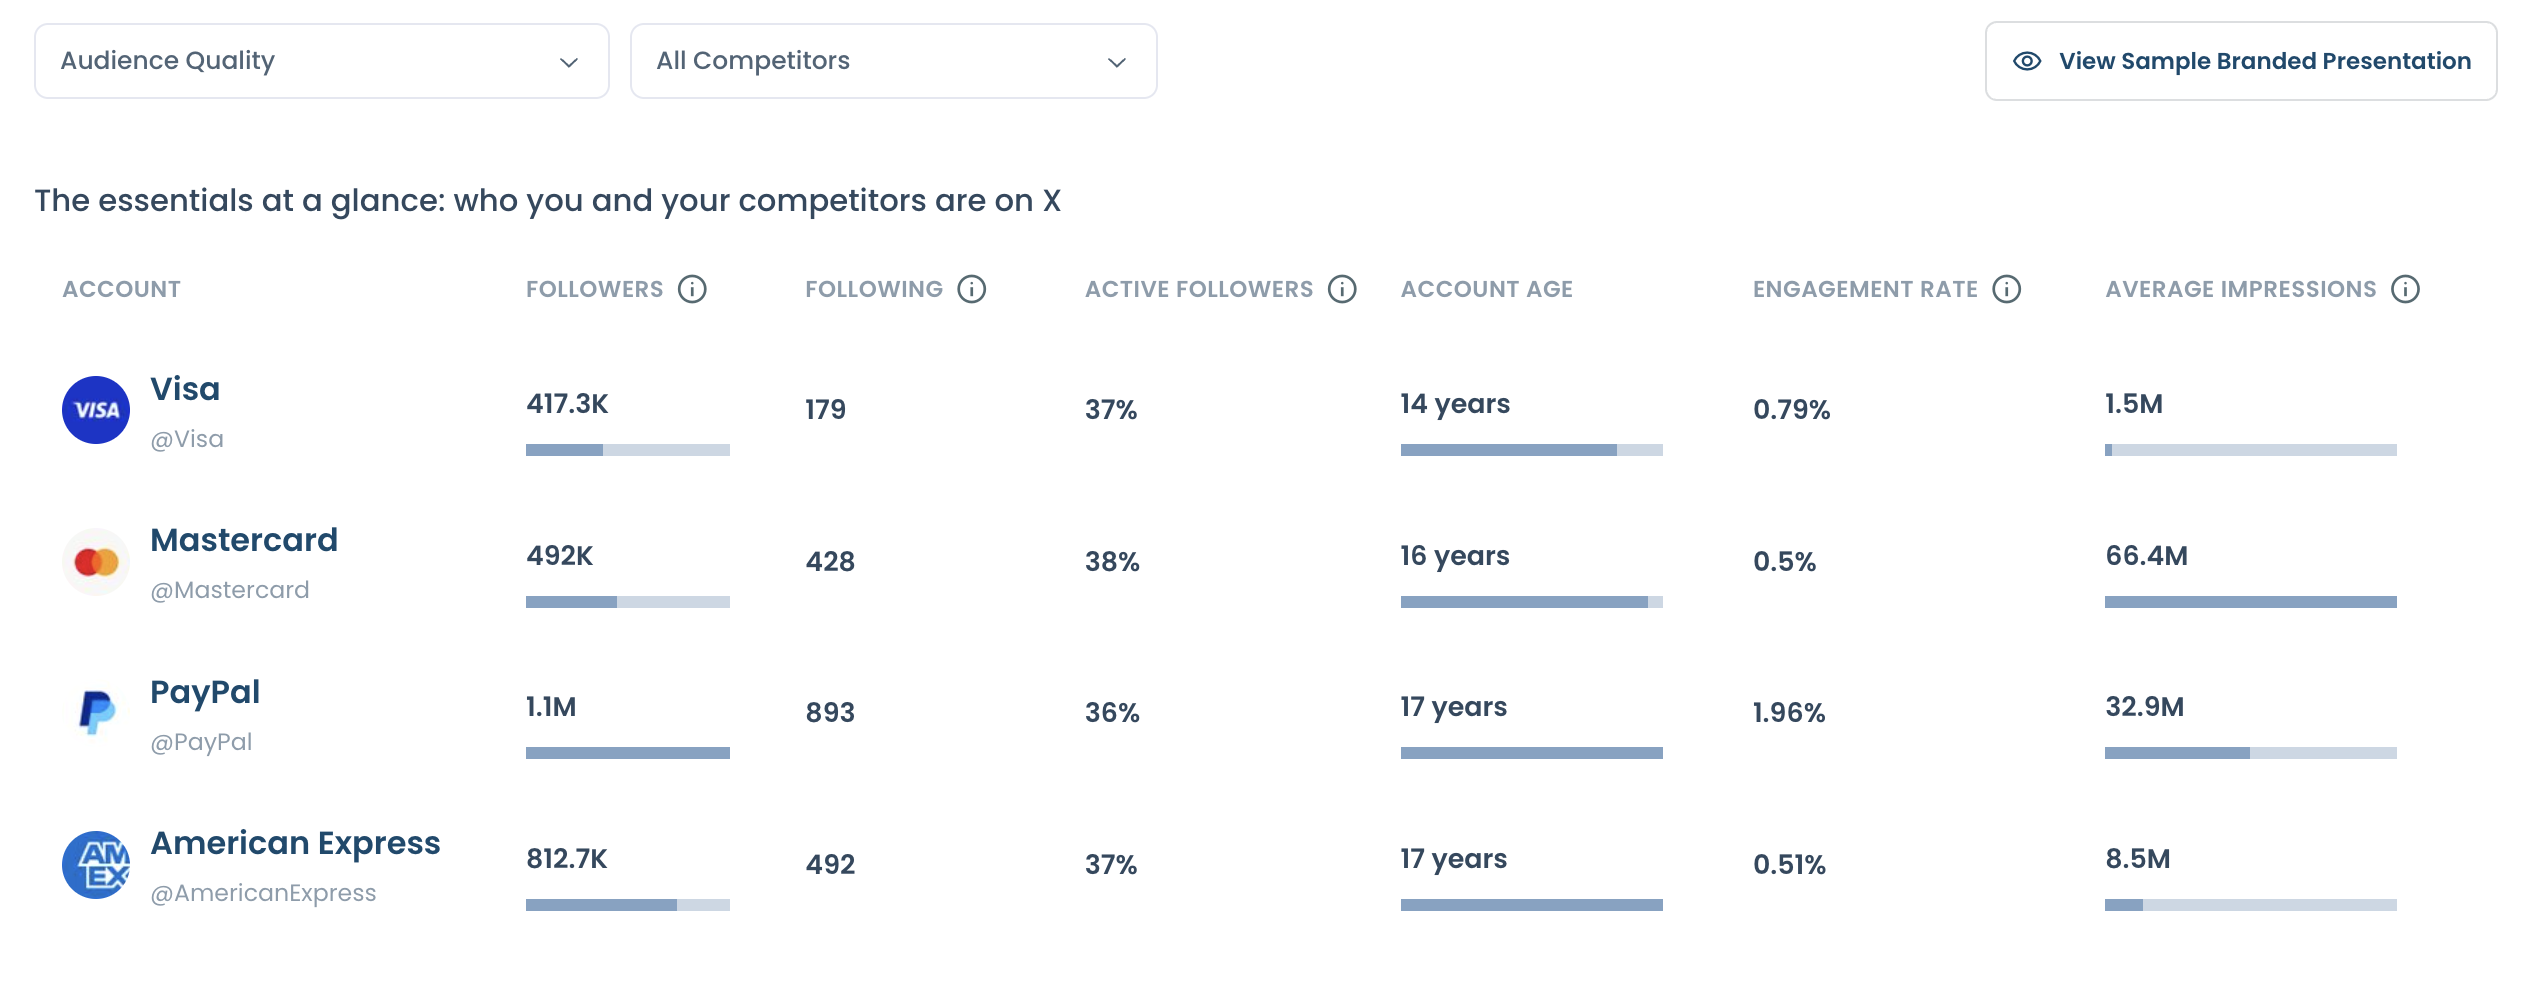
Read this way, the follower number becomes the last line of the answer and not the first. You already know what the count is made of, so a large one no longer reads as a verdict.
Treat a flat metric as settling nothing
When a metric lands at almost the same value for every account in the set, it cannot tell you who is ahead.
Circleboom's documented sample export, which compares four large brand accounts, shows this plainly. Verified followers sat between 2.1% and 2.7% for all four, and active followers between 36% and 38%. Neither figure separated anyone.
In the same sample, suspected bot share ran from 20% to 34% and the High tier from 2% to 17%. Those were the measures with real spread, so those were the ones worth arguing about.
Skip the flat rows and spend the time on the rows that differ.
What "worse" follower quality means on Twitter
Worse Twitter follower quality is a relative reading: your mix is weaker than the mix of comparable accounts, measured the same way on the same date. No fixed threshold exists, and the report does not print one.
| What you see across the set | What it suggests |
|---|---|
| Your High tier share is the smallest and your Low tier the largest | Your mix is the weaker one |
| Your shares sit inside the range of the other accounts | No quality gap; look at content and timing |
| A rival's count is far larger but its High tier is thinner | The count overstates that audience |
| Every account shows nearly the same share | That metric settles nothing |
The other three Audience Quality charts feed this reading without replacing it. Human vs Fake/Bot, Active vs Inactive and Ordinary vs Overactive each describe one trait. The tiers are the summary, and the drill-down lists of flagged accounts are the evidence behind each share.
What a weaker mix does not tell you
A weaker mix is not a list of people to remove. These classifications are review signals from Circleboom's analysis of official X records, not verdicts from X. A follower who rarely posts may still read every post you publish, and a low tier label is not an instruction to act on anyone.
A weaker mix is also a snapshot. Each report describes the audience as retrieved on its run date, so a trend needs at least two dated runs of the same set.
It says nothing about audience overlap either, so a quality gap cannot tell you whether you and a rival are reaching the same people. That reading comes from the report's Common Audience panel, where you choose two of the compared accounts and see how many followers and followings they have in common.
Which accounts should you compare your follower quality against?
Compare against direct peers: accounts that share your target market, language, scale, publishing purpose and business model. A fair read depends more on this choice than on any chart.
Two kinds of account get mixed up here:
- Direct peers, which measure where you stand.
- Aspirational references, the category leaders, which are useful for studying approaches.
Treating a leader's totals as your target is how a quality gap gets misread. A global entertainment-led brand and a regional support account can share a sector and still serve different goals.
The set also has hard edges. One report holds up to 5 accounts in total, only public accounts can be analyzed, and an account with more than 3,000,000 followers cannot be added. If you are unsure who belongs in the set, Circleboom's Find Influencers search is the place to look for comparable accounts first.
Scale deserves a second look for creators. A creator with 20,000 followers who benchmarks against accounts at 50,000 to 100,000 is studying the next stage, which is useful, but those accounts are references and not peers for a quality verdict.
Keep the set stable once you choose it. If you swap an account between two runs, say so, because a different group is not a change in your position.
How the side-by-side follower comparison works in Circleboom
The comparison takes three short moves, each covered below. Circleboom pulls followers, following and recent posts for every account in the set at once, so all columns share one date.
Circleboom is listed on X's Enterprise customer directory, so every account in the set is read from the same official X records. No column is filled in from scraped pages that can miss accounts, which keeps the comparison like for like.
Add the accounts to compare
After you log in to Circleboom, open the Monitoring menu and choose the X Competitor Benchmark Report. Type each handle into its own field under Account Handles. Your own account can take the first slot, and it never uses a Competitor Token.
Choose one report or a monthly schedule
Pick Just this once for a single dated report, or Keep it up to date every month to receive a fresh one automatically. Then select Start Competitor Analysis.
Tokens are charged per competitor per report, so a scheduled set costs competitors multiplied by reports. End Scheduling stops a schedule whenever you choose.
Finished reports are listed under Your saved analysis with their run dates. A rerun of the same set never replaces an earlier report, which is what makes a later comparison possible.
Open the audience quality charts
Go to Audience Quality and run the three checks above. A Followers / Following toggle on each chart switches between the people who follow an account and the accounts it follows.
To run it on your own peer set, start with an X follower quality comparison.

Why a follower quality gap costs reach on X
A weaker quality mix matters because X tests a new post on a small group of your followers before widening its reach. The report's Audience Quality page states this directly: fast engagement from that first group grows distribution, and no engagement slows or stops it.
If that group is drawn from an audience full of dormant or automated accounts, a good post can fail the first test. For the wider mechanics, Circleboom has a post on how the Twitter algorithm works.
Background viewing: a Twitter follower guide to the signal framework, useful context for why audience composition shapes distribution.
Composition can also shrink a size gap that looks decisive. Take a follower count, set aside the suspected bot share and the inactive share, and what remains is the audience that can respond to a post. Two accounts far apart on the profile page can sit close together on that figure.
The drill-down lists let anyone check the claim account by account. X's own rules treat padded numbers as a platform issue as well: its platform manipulation policy covers artificially inflated follower counts.
Is there one follower quality score or ratio for each X account?
No. The benchmark report shows Twitter follower quality as tiers, a three-way split of each follower list, and it contains no follower-to-following ratio metric and no ratio column in the essentials table.
That is a design choice worth understanding. A single ratio describes how one account follows and is followed. A tier describes the followers themselves, using ratio as one of three inputs. Quoting one number per rival would discard the part that separates accounts.
If you still need a single figure for one profile, two routes exist outside the report. Circleboom's Twitter Quality Score page covers a score for an individual account.
The blog also explains Tweepcred, what it is and why it matters for background on that score.
Use a score to describe one account. Use tiers to compare several.
What you gain once the Twitter quality gap is measured
A measured gap changes the next decision. If your mix is the weaker one, the work is on your own audience. If it is not, the follower count argument is over and attention moves to content and timing.
For the own-account side, three hand-offs cover most needs:
- To see who sits in your top tier, open your high-quality Twitter followers and friends and keep those accounts close.
- To look at your audience with no rival in the report, use Circleboom's Account Analysis Report.
- To run a free first check, try Circleboom's follower checker for Twitter.
For a fuller own-account method, the blog covers the best way to analyze your Twitter followers.
There is a quieter gain as well. Many of the report's most useful outcomes are decisions not taken: not chasing a rival whose audience is largely inactive, and not treating a large count as a target your team has to match.
The comparison I find most persuasive in a meeting is the simplest one: the tier chart for all accounts on one slide, with the report date and account set stated. It replaces an opinion with a sourced reading.
Checklist to confirm a follower quality gap on X
Before you act on a Twitter follower quality gap, confirm it with these steps:
- Choose direct peers of similar scale, and write down the set.
- Read the tier split first, then each share against its raw count.
- Ignore any metric that lands flat across the set.
- Read the follower count last.
- Schedule the report monthly so the next reading is already on its way.
A gap that passes all five is real. One that fails any of them is a number without context.
→ Run a follower quality comparison on X
Follower quality FAQ for X accounts
How do I review and remove low-quality followers when my low tier is the bigger one?
Review first, and remove only what you have checked. Circleboom's Low-Quality Followers list shows the accounts on your own X account; whitelist useful contacts, then stage selected accounts for removal. Removal runs gradually through the Circleboom Remove Twitter/X Followers Chrome extension, and a low tier label alone is not a reason to remove anyone.
Does the report update itself, or do I rerun it to see the gap move?
Either works, as long as you compare two dated reports for the same account set. With the monthly schedule on, Circleboom produces each new report automatically, and Get a new report with the latest X data re-pulls a saved set on demand. Earlier runs stay under Past Analyses, so nothing is overwritten.
What is the most common mistake when comparing follower quality?
Stopping at one chart. I see people read the suspected bot share, find it acceptable and conclude their audience is fine, when the tier split would have shown a thin High tier. Read the tiers, then the counts, then the follower number.