Most competitor reviews on X stop at the top posts, so teams keep spending effort on post types their category already ignores. The under-performing posts would show that, but a profile cannot be sorted by engagement, and the weak posts stay buried. The fix is a report that lists them for you, plus a reading method that stops you from drawing the wrong lesson.
Manual: opening rival posts one at a time, with no engagement sort on a profile and a different day for every account. Circleboom: shows the lowest-engagement tweet of each compared account on X in one panel, pulled on a single date through official Enterprise APIs.
→ competitor worst tweets
The steps come first, then a keep, rework or remove tree for your own weak posts.
Why rivals' weak posts on X are hard to find by hand
Weak posts are hard to find because X gives you no way to rank someone else's timeline. A profile runs newest to oldest, and the only way to locate the bottom is to open posts one by one.
Even when you do that work, the result is shaky. You check one rival on Monday and another on Thursday, each over a different stretch of posts, and the numbers cannot be compared.
The mistake I see most often is skipping the bottom entirely. Teams study what won, copy its look, and never ask which of their own regular post types the category has already stopped responding to.
Competitor worst tweets answer that second question. They show the posts an audience like yours saw and left alone.
Circleboom puts the bottom posts of several X accounts into one dated comparison, so the reading starts from the same fields for everyone. That is the practical way to see competitors' under-performing tweets without a week of manual checking.
What the bottom tweets panel shows for each Twitter account
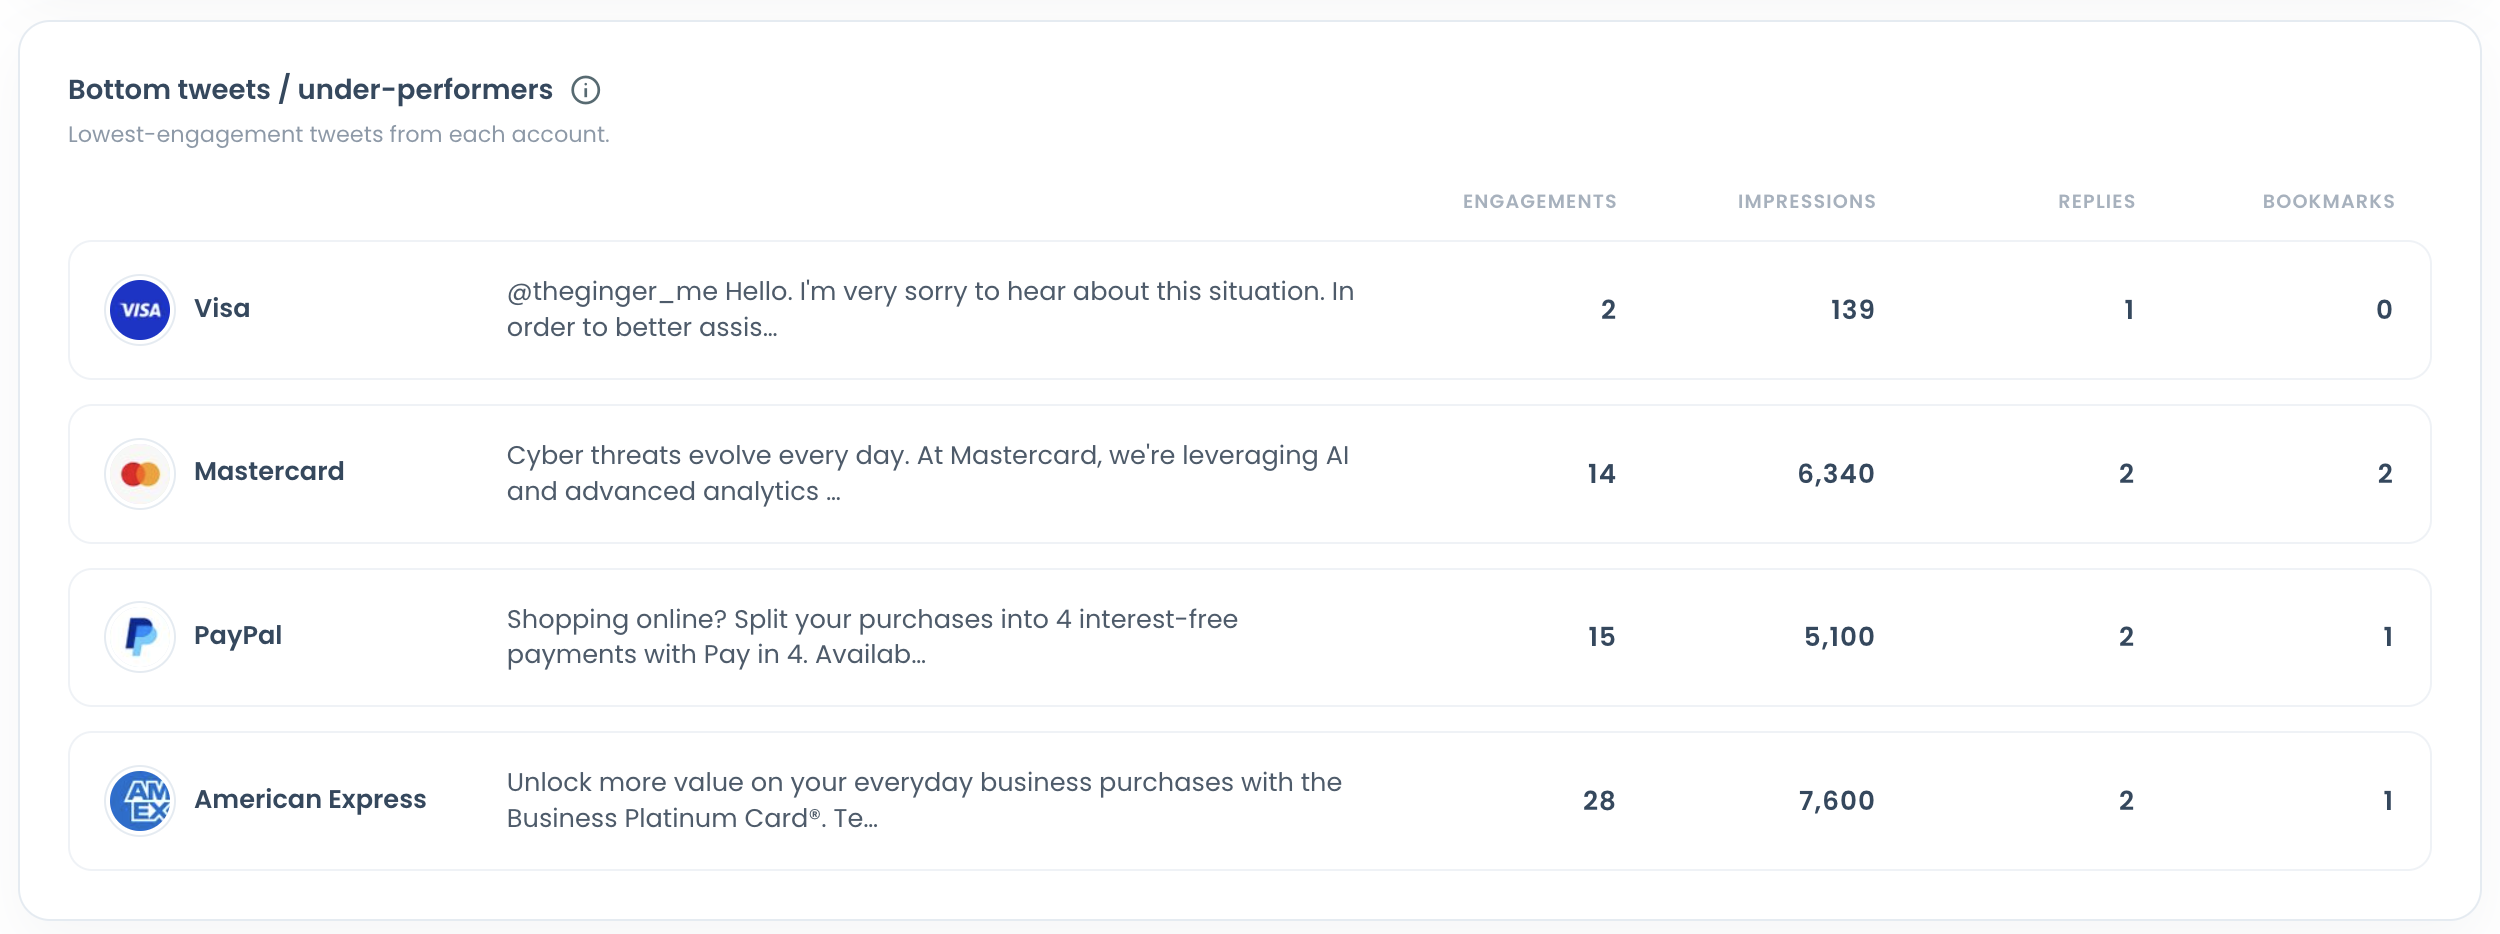
The panel shows the lowest-engagement tweet from each compared account. It is named Bottom tweets / under-performers and sits in the Content Leaderboards section of Circleboom's X Competitor Analysis & Benchmark Report.
Each row has the account name, the start of the post text and four figures: engagements and impressions, then replies and bookmarks.
Two of those figures do most of the work. Engagements tell you how much response the post drew, and impressions tell you how often it was displayed.
What the panel leaves out
The panel lists a single lowest post per account, drawn from the recent posts analyzed for that run. It is not a full account history.
The same number of retrieved posts can cover a few weeks for a frequent publisher and many months for an occasional one. Two rows may come from different stretches of time, which is one more reason to check each post's date before you compare them.
What makes the rows comparable
The report holds up to 5 accounts, and every section renders the same way for each one. All accounts in a run are pulled together, so every row reflects the same retrieval date.
The data comes through official X APIs, because Circleboom is one of the developers on X's official Enterprise list. For a brand or communications lead, that means the rows can be quoted in a review without an argument about where they came from.
Two limits are worth knowing before you choose accounts. Only public accounts can be analyzed, and an account above 3,000,000 followers cannot be added.
The panel is one half of a pair. The same section carries top-five leaderboards and a head-to-head of each account's best post, and this guide stays with the other end.
With those basics in place, the rest of this guide walks through the report where you can read the worst tweets of your competitors side by side.
How to find competitor worst tweets on X step by step
The steps, in order, with the reading rule built into the last phase.
Open the benchmark report inside Circleboom
- Log in to Circleboom and link your X account to it.

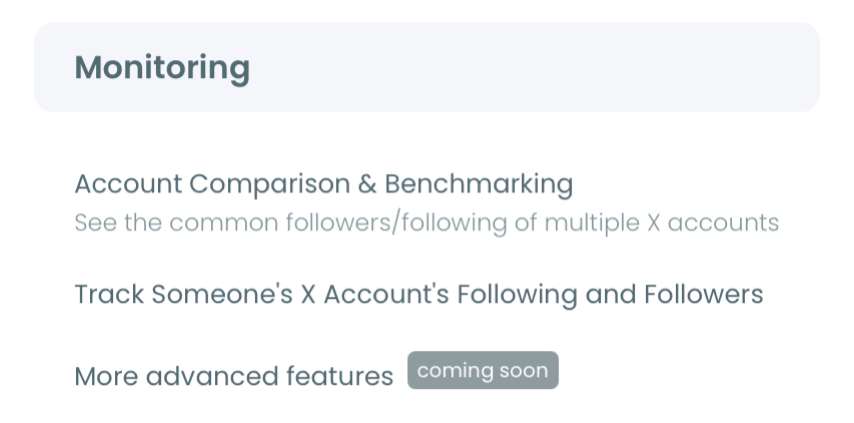
- Go to the Monitoring menu and select X Competitor Analysis & Benchmark Report. It is the first item, with the subtitle "See the full benchmarking report of X accounts."
Build the peer set and start the run
- Enter the handles of the accounts you want to read in the Account Handles panel, one per @ field. Pick direct peers that share your market and language, since their misses transfer to your plan.
- Select Start Competitor Analysis and choose between Just this once and Keep it up to date every month. The monthly option produces a new dated report each month with fresh data.
Read the under-performers against each account's normal
- Open the Content Leaderboards section of the finished report and find Bottom tweets / under-performers. One weakest post per account is listed there.
- Check each row against the same account's per-post averages in the Engagement summary table. A miss only counts when it sits well below that account's normal, and a days-old post or a customer-service reply should be set aside.
Each step narrows what the next one has to prove. Choosing peers first decides whose misses are relevant, one run puts every account on the same retrieval date, and the per-post average keeps you from treating a last-place post as a failed one.
The flow in four lines:
- Log in and open the report from Monitoring.
- Add direct peers and start the analysis.
- Find the under-performers panel in Content Leaderboards.
- Read each miss against that account's own average.
When does a weak post on X become a pattern?
A weak post becomes a pattern when the same kind of post shows up at the bottom for several accounts or across several runs. One run gives you one weak post per account, which is a clue. Look for the same kind of post in more than one row.
If three of four rivals have a link-only announcement at the bottom, that is worth writing down. If each row is a different kind of post, the finding is that the category has no shared weak spot this month.
A monthly schedule builds the evidence for you. Earlier runs for the same set stay under Past Analyses, so you can compare the panel across dated reports and see which traits return.
Write the finding at the strength the evidence supports. "Link-only announcements were the weakest post for three of four peers in two consecutive runs" is a sentence a stakeholder can check. "Links do not work on X" is a guess dressed as a rule.
For a PR or communications lead, the rows also work as a preview. They show how the category's audience treated an announcement style before your own team commits to it.
Read this way, competitor worst tweets stop being trivia about rivals and become a short list of things to test less often.
How do you find your own worst tweets on Twitter?
You find them by sorting your own post table from the bottom. Circleboom's Engagement Analytics lists each of your posts as a row with its metrics, and any metric column can rank the table.
This step is needed because the under-performers panel exists only in the competitor report. The single-account report does not include it.
Sort ascending by likes or by engagement rate and the weakest posts rise to the top of the table. The feature's own example is a useful picture of the result: an ascending sort that shows 120 tweets with 0 likes and 0 retweets.
Read your own bottom the way you read a rival's
Compare each weak post with your own average, and treat tiny samples with care. A high or low rate on a handful of impressions rests on too few interactions to support a conclusion.
Then look for what the weak posts share. Topic, format and posting hour are the first three things to line up.
The same ranking is where a cleanup begins, which is the idea behind guides on how to mass delete tweets based on popularity. Ranking comes first, and deciding comes second.
For a quick public check on one account, the free Twitter X Metrics Calculator reads the last 100 posts and returns the best and lowest performing tweet.
Keep, rework or remove: a decision tree for your own weak X posts
Every weak post of your own gets one of three outcomes: keep, rework or remove. The branch depends on why the post was weak, and the engagement number alone does not decide it.
| If the weak post... | Then | Why |
|---|---|---|
| Did a different job, such as a reply or a service notice | Keep | Low engagement was never the measure for it |
| Had unclear content or matches a recurring mismatch | Rework | The idea may be sound and the delivery was not |
| Drew zero engagement and has no purpose you can name | Remove | It lowers the timeline's average and helps no one |
Back up your posts before the third branch. A copy must exist before any removal, because deletion cannot be reversed.
Keep: the post served another purpose
Keep a post when engagement was not its job. Replies to customers, corrections, event logistics and pinned policy notes belong here.
The competitor report makes the same point about rivals. An account that publishes mostly replies is handling customer service on its timeline, and its low rows are not content failures.
Rework: the idea was fine and the post was not
Reworking fits a post whose topic matters to your audience while the post itself was unclear. A recurring mismatch is the stronger signal: the same format or hour at the bottom again and again.
Reworking can mean rewriting the opening line, moving the link out of the first post, or publishing at an hour when your audience is active. Test one change at a time so you can tell which one helped.
Your own post table hints at which change to try. A post with many impressions and weak engagement was seen and not acted on, which points at the opening line. A post with a strong engagement rate on few impressions points at timing, and it is a candidate to publish again at a better hour.
Remove: zero engagement and no purpose
Remove a post only when both conditions hold. Zero engagement with a clear purpose is a keep, and a little engagement with no purpose is usually a rework candidate.
If you are unsure where an old tweet falls, there is a fuller treatment of what to delete and what to keep. I leave borderline posts alone, since a kept post costs nothing and a deleted one is gone.
One expectation to set: removal tidies your timeline's average, and nothing X has published says it lifts the reach of what you post next.
Removing your zero-engagement tweets on Twitter: filters first, delete last
You can delete only the zero-engagement posts, and the filter is what makes that safe. On the platform itself, X's Help Center explains how deleting works on X, and it is an action taken on one post at a time.
Circleboom's delete tools filter first and delete in bulk after you confirm. Its page for Delete Low-Engagement Tweets covers the full flow, so this section stays with the settings that matter for weak posts.
These are the controls to know:
- Like count and retweet count ranges, with inclusive minimum and maximum values
- Checkboxes for tweets, retweets and replies
- A Protect List for posts that must never be deleted
- An Approve & Delete panel with the final count before you confirm
Set both ranges to zero to isolate posts with no likes and no retweets, and add anything from your keep branch to the Protect List.
What to expect when the deletion runs
Nothing is deleted until you click the confirm button, and the count on the approval panel is your last check. API rate limits apply during execution, so a large batch is processed gradually and takes time.
The full-history route needs the tweet.js file from your X archive, while the recent-posts route covers your latest 3,200 tweets. If likes are your only criterion, a separate article covers how to delete all your tweets with fewer or no likes.
Clip for the removal branch: how to delete multiple tweets on X once the keep, rework or remove call is made.
What ignoring rivals' misses on X costs your team
Without the bottom of the table, a team learns only from winners. It keeps funding post types the category has stopped rewarding, and each flat post gets blamed on timing or luck.
With it, the same team has evidence before the effort is spent. A trait that sits at the bottom for several rivals, run after run, is a warning you get for free.
I would rather learn that lesson from someone else's timeline than from a quarter of my own.
The same habit improves your own cleanup. A team that reads rivals' misses against their averages will read its own weak posts the same way, and it will keep the ones that were doing a different job.
The cost of looking is one report. The cost of not looking is every post you publish into a pattern your audience already ignores.
→ find your competitors' worst tweets
Questions that come up once the bottom tweets are open
Should I save a copy of my tweets before I remove the weak ones?
Yes, always. A backup has to exist before deletion, because exporting afterwards cannot recover a post that is already gone. Circleboom's blog explains how to back up your tweets on X before you start.
Could a tweet at the bottom be hidden instead of weak?
It could, and impressions help you tell. A weak post has impressions and few engagements, while a restricted post or account struggles to be shown at all. Circleboom's Shadowban Test checks an X username for five visibility restrictions if you suspect the second case.
Can I get a deleted tweet back if I change my mind?
No. Deletion is permanent, and your downloaded archive is the only record afterwards. The count on the approval panel is the last point where you can still stop.
Can the report list bottom tweets for any account I choose?
Any public account at or below 3,000,000 followers can be added to Circleboom's competitor report on X. Private accounts and accounts above that size cannot be analyzed.
What does adding one more competitor to the report cost?
The charge is one Competitor Token for each competitor in each report, and no token is ever taken for your own account. A one-off report with 5 competitors costs 5 tokens, and a monthly schedule multiplies that by the number of reports.