
In one sample comparison of four public brand accounts, PayPal, the account that put the most into media and video, earned the lowest engagement rate of the set. A team that copied its format mix from the timeline would have copied the part that was not working. Reading a competitor's content strategy on X means checking what returns, and the order of the checks matters.
By hand: a week of scrolling and a post count nobody can verify. Circleboom: one run, and Circleboom compares up to 5 accounts on X by posting behavior and format results through official X Enterprise APIs.
→ competitor content strategy
Four questions, asked in a fixed order, do the reading.
Why a rival's Twitter timeline is a poor record of their strategy
A timeline shows single posts, and a competitor content strategy lives in the totals behind them. You can see that a rival posted a video yesterday. You cannot see what share of their output is video, or whether video ever leads their results.
The most common mistake is a hand-built comparison. Someone counts a rival's posts for a week, eyes the likes, and writes a plan from it. Each of those numbers was gathered a different way, so the plan cannot answer a basic question: did the periods even match?
A single measure also points at the wrong fix. A low response has several possible causes, and each cause carries a different cost to fix. That is why it pays to read a competitor's content strategy on X as a set of measures taken on one date.
What Circleboom compares when it reads accounts on X
Circleboom's X Competitor Analysis & Benchmark Report places up to 5 accounts side by side and repeats the same charts for each one. You can include your own account plus up to 4 competitors, or leave yours out and enter 5 other accounts.
Two of the report's sections carry most of a competitor content strategy:
- Posting Behavior covers pace, consistency, posting hours and post length.
- Content Type & Format covers the format mix, the top-performing format, link and media share, and the post-type split.
Content Leaderboards then show the actual posts behind those charts.
As an official X Enterprise Developer, Circleboom retrieves each account's records through X's own APIs. Every figure is calculated from those records, which gives you a source to name when someone questions the reading.
The report pulls up to about 3,200 recent tweets per account, so it describes a recent window. With that window in view, you can analyze a competitor's content strategy from what the account does, not from what it announces.
Keep the platform in mind while you read, because a format that leads on another network may not lead here. Treat determining the best content for each social media platform as a separate decision from copying a rival.
How to read a competitor's content strategy on X step by step
To read a rival's strategy, run one comparison that includes your own account, then open the two sections that describe publishing. The six steps below take you from an empty form to the two panels the reading starts from.
Run one comparison for the whole peer set
- Open Circleboom Twitter Management and sign in with the X account that will sit in the first column of the report.
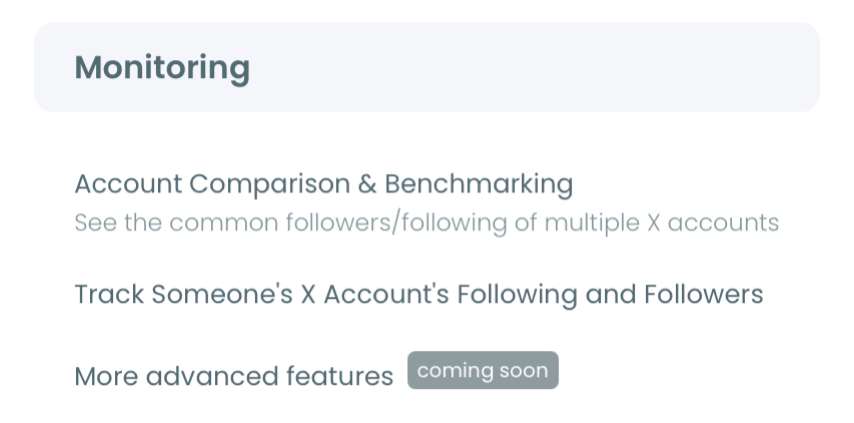
- Select Monitoring in the menu and choose X Competitor Benchmark Report, the first item in that menu.
- Enter your own account and the rivals, one per slot. The Account Handles panel shows a counter in the form "N of 5 competitors added," and the + button adds a slot until the set holds 5 accounts.
- Click Start Competitor Analysis and set the schedule. Just this once produces a single report. Keep it up to date every month produces today's report plus one automatic report each month.
Choose the set with care before you move on. Accounts that sell to the same market at a similar scale are peers you can measure against. A category giant is a reference for ideas, and its totals are a poor target for a smaller team.
Open the two sections that hold the strategy
- Scroll to Posting Behavior. Note each account's Lifetime Average and Last 30 Days Average for posts per day, along with its Steady or Burst label.
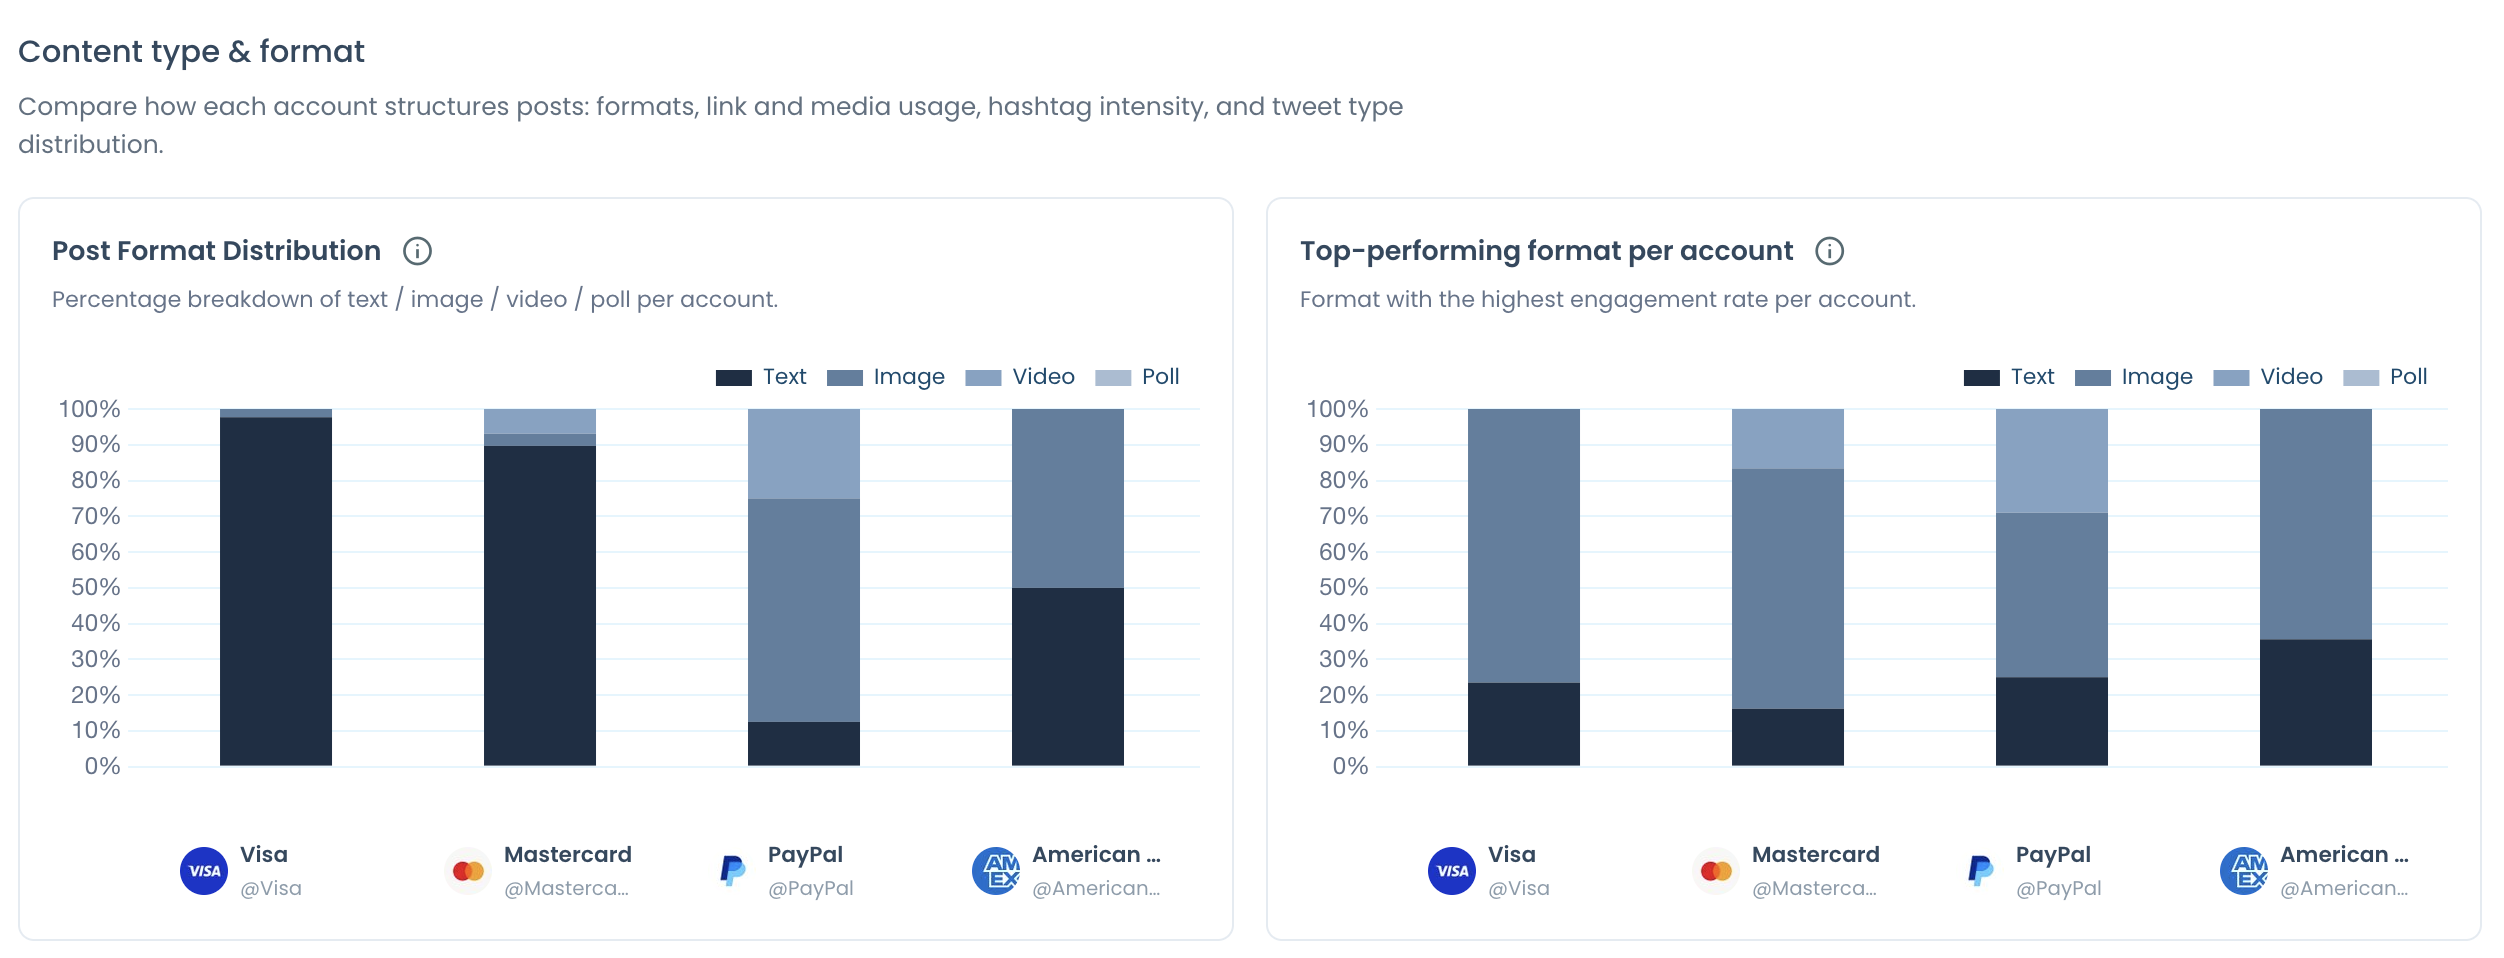
- Continue to Content Type & Format. Two panels sit side by side here: Post Format Distribution on the left and Top-performing format per account on the right.
Running every account in a single comparison is what makes the reading defensible. All accounts are pulled on the same date and measured the same way, so a difference between two bars is a difference between two accounts.
The run in four lines:
- Sign in and open Monitoring.
- Enter your account and up to 4 rivals.
- Start the analysis, once or monthly.
- Read Posting Behavior, then Content Type & Format.
The four questions to ask of a rival's X account, in order
A report full of charts invites a scan. A competitor content strategy reads better as four questions, each answered by one panel, in an order where every answer narrows the next.
What is the account for?
The Original / Reply / RT / Quote distribution panel answers this, and it comes first because it decides whether the rest applies. It shows how each account's activity divides across the four post types.
There is no ideal split. The panel tells you what kind of work the account does:
| What the split shows | What the account is likely doing | Use it as a content benchmark? |
|---|---|---|
| Mostly original posts | Publishing | Yes |
| Mostly replies, with service answers among its top tweets | Customer support | No |
| A large reply share beside steady originals | Growing through conversation | Yes, reply habit included |
| Mostly reposts | Amplifying other accounts | Only for what it chooses to share |
Most advice on competitor analysis treats every rival as a publisher. Some are not, and their pace and formats describe a different job.
How often and when does it post?
The cadence panel answers the first half with two bars per account. When the recent bar is far shorter than the lifetime bar, the account has cut its output from an earlier high. It is still posting.
The consistency label, written in the form "Burst · CV 3.40," tells you whether the output is even or spiky. Bursts can come from events or campaigns, so the label alone is not a verdict.
For the second half, the report draws a posting time-of-day heatmap for each account. A rival's hours show you the crowded windows. Your own audience decides the rest, which calls for a best time to post on Twitter check on your own account.
Two panels in this section are easy to misquote. Post length appears as a typical character range per account, with no single average. The timing alignment panel is a visual overlap of two curves, and it prints no score.
What does it invest in?
Post Format Distribution answers this with a percentage breakdown of text / image / video / poll per account. Read it as a map of production effort.
The Link & Media share panel adds the share of tweets that carry media and the share that carry external links. The two shares can overlap, and neither one proves an advantage.
A common format is not the best-performing format. It is only the one the team makes most.
What returns?
Top-performing format per account answers this. It names the format with the highest engagement rate for each account, and the report's engagement rate is total engagement divided by total impressions.
How to set format share against format results
Hold the two panels against each other, as two separate readings:
- Share and leader match. The effort is paying off. This is the part of a rival's routine worth studying.
- A small-share format leads. Check the leaderboards first. One standout post is a narrower signal than repeated results.
- A big-share format never leads. The account is spending where it does not earn.
Here is an illustration with made-up round numbers. Say a rival's video tweets average a 4% engagement rate and your image tweets average 1.5%. Testing more video is then a clear experiment, as long as the rival's video result comes from more than one post.
A format that absorbs most of the effort but is absent from the leaders is the cheapest thing to change.
That rule applies to a rival and to you. In the rival's column it tells you what not to copy. In your own column it tells you where to stop spending before you add anything new.
The report cannot answer every format question. Thread usage rate is not in it, and neither is an @-mentions metric, so leave both out of your conclusions.
The broader question is what type of content people most like on Twitter (X). A general view helps there, but your category's own leaders are the stronger evidence.
How to check the reading before you act on it
Confirm each answer in more than one place before it changes your plan. A competitor content strategy read from a single chart is an opinion with a source attached.
The leaderboards are the first check. The posts with the most impressions and the posts with the most engagement are often different posts, so a format can win attention without winning a response. The bookmark leaderboard also tends to show reference-style posts that never reach the engagement top five.
The second check is time. Each run is a dated snapshot of a rolling sample, so a changed average can come from new posts or from older posts leaving the window. Compare two dated runs of the same set, and trust a change that shows up in the per-post averages.
Can you pull a competitor's posts into a spreadsheet?
Yes. Circleboom's Export Tweets downloads up to 3,200 tweets from a public Twitter/X account as a CSV file, so you can sort and tag a rival's posts yourself.
The ceiling comes from the platform. X's own API documentation states that the user Posts timeline returns up to 3,200 of an account's most recent Posts.
What you can filter before the export
You can narrow the file before you download it. The filters include:
- post type
- date range
- engagement ranges, such as minimum likes or impressions
- language
- keyword
Each row then carries the tweet text and its publication time, followed by its performance fields.
A tight filter makes the file more useful than a full dump. Exporting only a rival's tweets above a likes threshold, for example, leaves you with a short list of ideas their audience already rewarded.
The export is the natural follow-up to the leaderboards, because the report shows each account's top 5 tweets and the sheet shows the rest of the window.
To do this, export tweets from the rival's handle.
From the Circleboom channel: downloading all tweets from a Twitter/X account, the export you run when five leaderboard posts are too few to judge a format.
Official API access names the source of the data. It does not lift X's limits, so treat the sheet as the same recent window the report uses.
What a rival's audience cares about on Twitter
The Audience bio keywords panel shows the most common words in the bios of each account's followers. Those words point to professions and interests, which tells you who the rival's content is written for.
Read them as self-descriptions. A repeated bio term suggests topic relevance, and it does not confirm buying intent. As an illustration, if "developer" leads a rival's keyword cloud, technical content is likely to attract that same audience.
This panel sits in the audience block, which has a Followers / Following toggle. The toggle changes audience panels only. Posting Behavior and Content Type & Format read the same in both views, because they describe the account's own posts.
For your own followers, Circleboom's interest targeting on Twitter page covers the same question from your side of the comparison.
A rival's audience and yours are rarely identical. Before you write for their keywords, confirm the overlap in topics, and see how to check interests on Twitter for that check.
A checklist before you borrow from a rival on X
A team can fund a format for a year because a rival used it a lot. The four questions exist to stop that, and they fit on a short list.
Keep these beside the report:
- Confirm the account publishes before you benchmark it.
- Compare its last 30 days with its lifetime pace.
- Set format share beside the top-performing format.
- Open the leaderboards and read the posts.
- Change one thing in your own plan, then run the report again.
Once the list is done, you have read the competitor content strategy and the remaining work is your own posts. For that part, start from tips for brands to get better engagement on Twitter. Apply them to the one format you chose to test.
→ Run your competitor content strategy reading
What to know when reading a competitor's Twitter content strategy
How do I measure my own content the same way?
Add your own account to the comparison, and it gets the same sections as every rival. Figures that only an account owner could see are excluded for everyone, so your X account is compared with theirs on identical fields. For post-level detail on your own account, use Circleboom's post analytics features.
How do I turn a rival's posting pattern into my own calendar?
Pick the one difference you can act on, and schedule around it. When a rival simply posts more often, schedule a fuller queue in Circleboom's X Post Planner, sized to what you can sustain. When the difference is a format, try it on a handful of posts and read your own numbers before you commit.
How many rivals fit in one report?
Up to 5 accounts in total. That means your own account plus up to 4 competitors, or 5 other accounts without yours. Competitor Tokens are spent for each rival in each report, and your own account is never charged.
Can the comparison refresh itself every month?
Yes. When you start the analysis, pick Keep it up to date every month, then enter the number of months it should run and the day of the month. Each run is saved with its date, and End Scheduling stops the series.