
Read only the followers of four payment brands in a sample report on public accounts, and they look alike: 2% to 3% verified, 75% to 81% English.
Flip the same report to the accounts they follow and the share jumps to 25% to 47% verified, with editors on one list and Olympic properties on another.
To compare brands on Twitter for PR or partnership work, you need both views.
Why read both lists when you compare brands on Twitter?
Followers describe who a brand reaches, and following describes who it chose. With Circleboom, you can read both sides for up to 5 brands on X through official Enterprise APIs.
→ Flip the Following view to compare brands on Twitter by what they invest in
Why the follower side of a brand comparison stops too early
Most brand comparisons on Twitter stop at the audience, because that is the only list anyone asks about.
For a marketing lead that may be enough. For a PR or partnerships analyst, it leaves out the part of the account that was built on purpose.
A follower list accumulates. People arrive and go quiet, and some were never people at all.
A following list is chosen, one account at a time, by someone at the brand.
The common mistake is treating the second list as a smaller copy of the first. It behaves nothing like it, and that gap is where a competitor's media relations and sponsorship choices become readable.
You can compare brands on Twitter from both sides without building either list by hand.
The figures in this guide come from the sample report, which sets Visa, Mastercard, PayPal and American Express side by side on public data.
They show the pattern, and they are not current facts about those companies.
Which X handle to enter when a brand runs support and marketing accounts
Enter the handle that does the job you are studying, and use the tweet-type split to confirm it. Large brands often run a marketing account, a support account and regional accounts, and only one of them speaks for the campaign.
One account in the sample runs at roughly 2% original posts, with customer-service replies holding most of its top five tweets. Its averages describe a support desk, so a benchmark drawn from it would be a category error.
Two panels settle the question as soon as you open the report:
- Original / Reply / RT / Quote distribution: a support handle sits almost entirely in replies.
- Top 5 tweets by engagement: service replies among the leaders confirm what the split suggested.
A support handle still has a following list worth reading, but it answers a different question than a marketing handle's list does.
Label which kind you entered, because a mixed set makes every average harder to explain.
Outside payments, the best beauty brands on Twitter give you a ready shortlist to practice this handle check on, since a single category can hold both kinds of account.
How to compare brands on Twitter in two passes
With Circleboom's X Competitor Analysis & Benchmark Report tool, you can run the same 9 sections for up to 5 public brand accounts on X, on one date, and switch the audience block between followers and following. Circleboom is listed on X's Enterprise customer directory, which matters to analysts who have to name their source.
The records come from X, and the classifications are Circleboom's calculations from those records.
Unlike a hand-assembled list of who a rival follows, this keeps the same fields and date for every brand. You can run a same-date brand comparison on X and quote it with its basis.
The process, in two passes after a short setup.
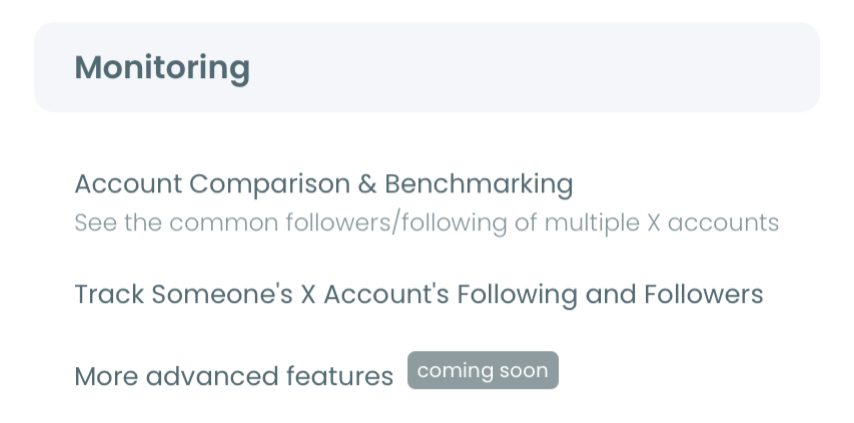
Log in and open the Monitoring menu
- Log in to Circleboom and connect your X account.

- Open the Monitoring menu and select X Competitor Analysis & Benchmark Report.
Enter the brand handles and start the run
- Type up to 5 handles under Account Handles, using the + button for each extra slot. Your own account is optional.
- Press Start Competitor Analysis and choose Just this once or Keep it up to date every month. A 12-month schedule produces 13 reports, and Competitor Tokens are charged per competitor per report.
Read the Followers pass for the audience
- Keep the toggle on Followers and read Audience Quality, then geography, language and bio keywords. Note where each brand's audience sits and how much of it looks active.
Flip to Following for relationships and sponsorships
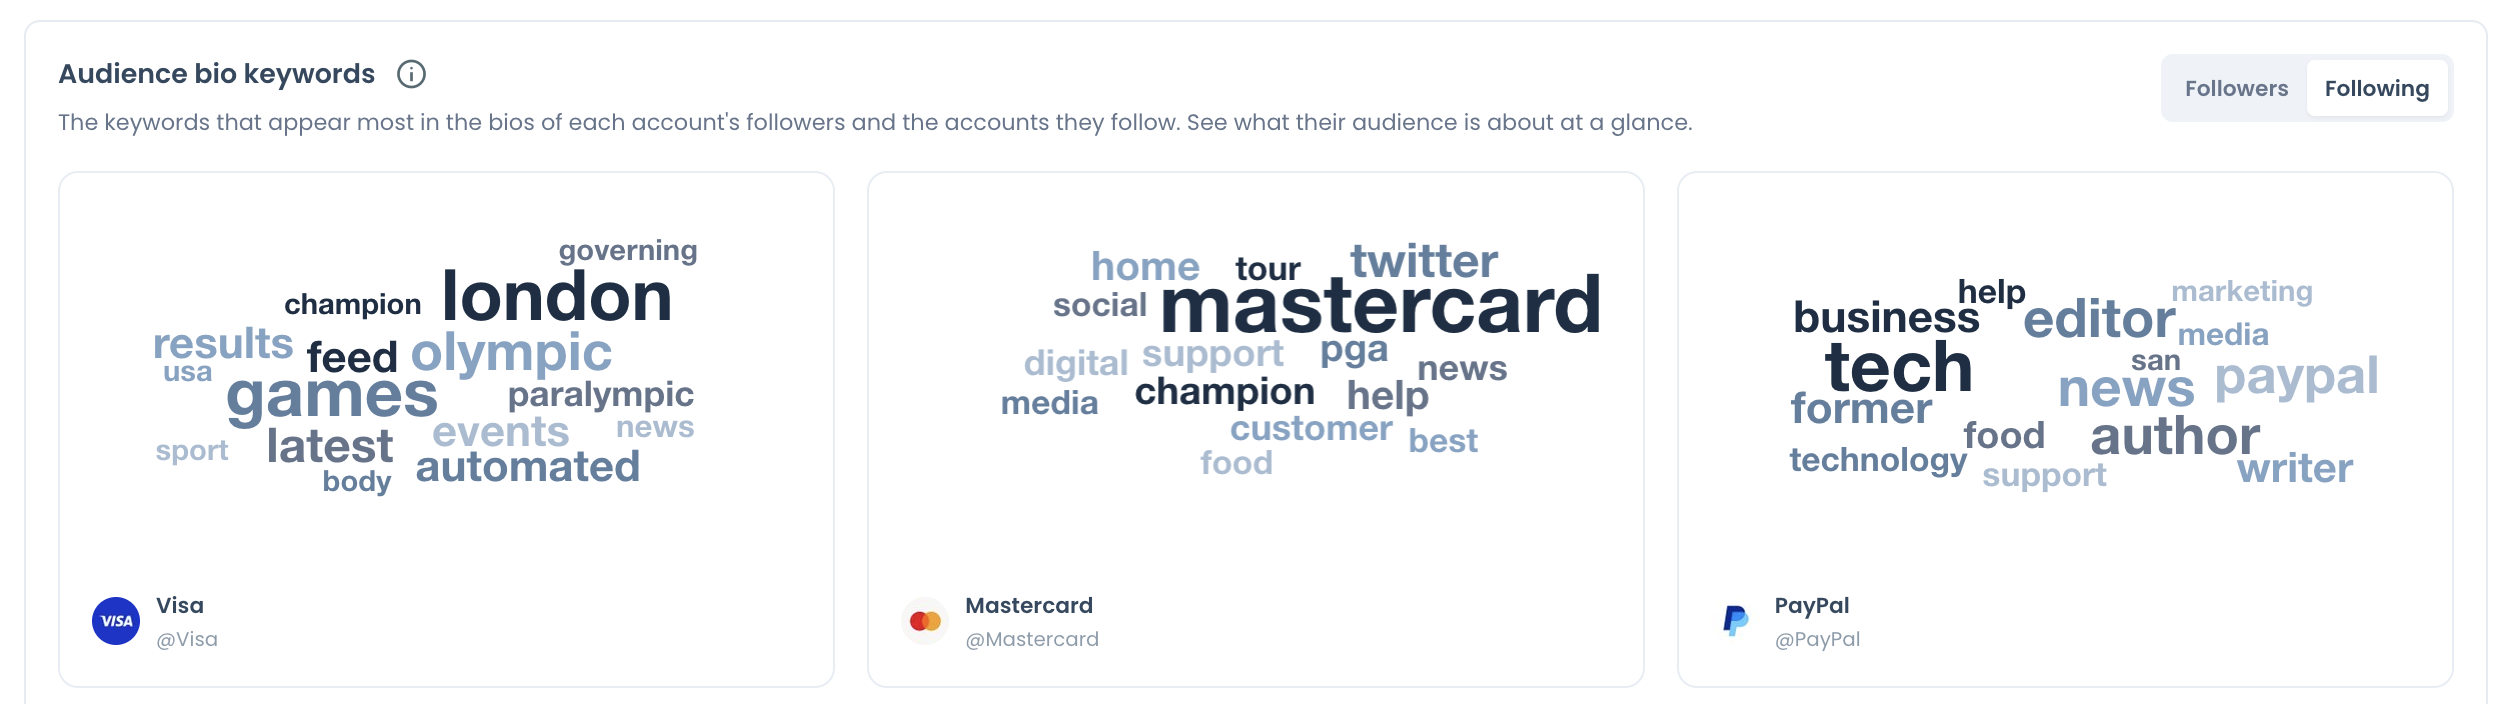
- Switch the toggle to Following and open Audience bio keywords to see what each list was built around.
- Compare verified share and quality tiers against the follower side of the same brand, then open the Verified list to see the accounts themselves.
The order matters because the second pass only means something against the first. A 40% verified following list is a finding next to a 3% verified audience, and it is just a number without one.
Quick recap:
- Followers tell you who the brand reaches.
- Following tells you who the brand picked.
- The contrast between the two is the finding.
What the Following view of a brand account reveals
The Following view reveals who a brand invests in off the platform, read from a list it chose by hand. The sample report shows how far apart the two sides of one set of accounts can land:
| Measure | Follower side | Following side |
|---|---|---|
| US share | 53% to 68% | 78% to 93% |
| English share | 75% to 81% | 96% to 98% |
| Verified share | 2% to 3% | 25% to 47% |
| High quality tier | 2% to 17% | 65% to 86% |
The bio keyword clouds are where a following list starts to name names. In the sample, Visa's cloud carries olympic, games, paralympic and london, which reads as a sponsorship portfolio.
PayPal's carries editor, author, writer and news, which reads as a media relations list.
Mastercard's leans on tour, champion and pga, its own tournament and championship properties.
No engagement metric contains that map.
Keep one rule in view while you read it. Following-side percentages describe the accounts the brand follows, never the people who follow the brand, so a 96% English following list says nothing about its customers.
The toggle also changes the audience block only. Posting behavior, engagement, impressions, leaderboards and video stay identical in both views, because they describe the brand's own posts.
Turn the pattern into a working list
A keyword cloud gives you the direction, and the accounts behind it give you the list. The report following export is the natural next stop when you want those names in a sheet.
The report followers export does the same for the other side, which keeps the audience pass and the relationship pass in matching form.
Label both exports with the brand and the run date, so the next report lines up with this one.
For a quick look at one rival's list on its own, a Twitter following list viewer is enough.
Read any list as a set of leads for review: following an editor doesn't prove a relationship, and following an event doesn't prove a contract.
The reverse question deserves a look as well. Rival lists show who a competitor invests in. Meanwhile, your brand advocates on X are the people already speaking up for you.
Those relationships are the cheapest ones to build on, and engaging followers and following shows who is responding today.
How to quote a Following view finding in a PR brief
Quote a Following view finding with its run date, its account set and its basis, because a percentage alone invites the first challenge in the room. A few reading habits keep the finding defensible:
- Read the share beside the count. In the sample, Mastercard's list is 47.1% verified with 201 accounts, while PayPal's is 25.1% with 224, so the smaller share holds more accounts.
- Check the country names. The geography chart plots the four largest countries plus an Other bucket, so the named countries can differ between the Followers and Following views.
- Treat bio words as self-description. A repeated word tells you how those accounts describe themselves. It doesn't confirm a deal, a budget or a working relationship.
- Label the source. The records come from X, and the classifications, tiers and breakdowns are Circleboom's calculations from those records.
Comparing two dates needs one more check. Each run is saved with its date, so a later report on the same set shows whether a brand's following side has changed.
Keep the account set the same between those runs. If you add or replace a brand, say so in the brief, because a different group is not a change in position.
Should a rival brand's video output change your video budget?
Not by itself, because video output measures effort and the results are recorded in a separate panel. In the sample, the account with the only meaningful video rate, 25%, also carried the lowest engagement rate in the set, 0.39%.
For a PR or partnerships team, this question usually arrives as a request to match a rival's sponsored video. Before you agree, read these panels in order:
- Video posting rate: if 1 in 5 of a rival's tweets carries video and 1 in 50 of yours does, you have found a format gap, not yet a reason to fund it.
- Total video views: divide by the number of videos, because a tall total can reflect many clips rather than strong ones.
- Engagement rate over time: this rate is total engagement divided by total impressions, so it shows how often viewers of a post responded.
Competitor retention curves are not part of this report. Your own Twitter video analytics covers that once you have clips of your own to study.
If the numbers argue against a big production budget, you still have options. Try low-cost ways to increase your reach and impressions first.
A rival's output should not set your plan on its own.
A short summary of the two-pass brand comparison on X
Comparing brands on X in two passes gives you the audience each one reaches and the relationships each one chose. The first pass corrects the follower count, and the second shows media and sponsorship ties that no post will ever announce.
Run the second pass every time, because it holds the relationships no engagement metric contains.
Check the handle first, read followers before following, and quote every figure with its date and its account set.
→ Start comparing rival brands on Twitter from both lists
FAQ for PR teams comparing brand accounts
Can a global brand and a regional brand be fairly compared?
Yes, if you label the global brand a category reference and judge the regional one as a direct peer. Circleboom's report on X treats both the same, so the fair reading comes from your peer choice and from per-post figures rather than totals.
A regional team with a small budget will find Twitter ads for small businesses a closer model than a global rival's plan.
Can I measure share of voice between brands on X?
It can in terms of impressions and engagement against the named rivals in your set. Circleboom's X report has no @-mentions metric, so press and public chatter about a brand sit outside it.
Compare average impressions per post across dated reports to see the direction.
Does this X report replace social listening?
No, since the report reads accounts, while listening follows keywords and topics. Pair it with Circleboom's Twitter keyword and hashtag tracker when you need the conversation around a campaign or a brand name on X.
Can a PR analyst compare X brands they don't manage?
Yes, and that is the normal setup for a PR analyst. Circleboom lets you fill all 5 slots with public X accounts and leave your own out, as long as none is above 3,000,000 followers.
Every one of those slots is charged as a competitor.