

Two X accounts post the same thread on the same morning. One has 80,000 followers, while the other has 9,000. By the afternoon, the smaller account's post has three times the impressions.
That outcome is normal on X now. Ranking runs on predicted engagement, so the size of an audience matters less than how much of it responds. Before X pushes its next model update, it's worth knowing exactly where your account stands.
What changed in X's algorithm
In January 2026, X published the code behind its For You feed on GitHub. The release confirmed what many accounts had already noticed in their analytics: the hand-tuned rules were gone. According to TechCrunch's coverage, the system now relies entirely on a Grok-based transformer that learns relevance from how users engage.
The feed is built in three stages:
- Candidate sourcing. X pulls posts from accounts you follow, plus posts from accounts you don't follow that a model predicts you'll care about.
- Ranking. A model called Phoenix, adapted from xAI's Grok-1, estimates how likely each viewer is to like, reply to, or repost each post.
- Filtering. Duplicates and blocked content are removed, and the feed is mixed so one author doesn't dominate it.
Follower count still matters in the first stage, because your followers are the main pool of in-network viewers. After that, the ranking model only cares whether each viewer is likely to interact. Reach outside your follower base depends on predicted engagement alone.
X also committed to updating the public code every four weeks. The largest update so far, in May 2026, added a content-understanding system that reads what posts are about. The model is retrained constantly, so a format that works this quarter can stop working next quarter.
How to calculate engagement rate on X
Engagement on X covers likes, replies, reposts, quotes, link clicks, and profile clicks. There are two useful ways to turn that into a rate:
- By impressions: (engagements ÷ impressions) × 100. This shows how a post performed with the people who actually saw it.
- By followers: (engagements ÷ followers) × 100. This shows how much of the audience you built shows up.
Track both, because they answer different questions.
Say a men's health clinic that posts about testosterone replacement therapy has 50,000 followers, and a post gets 12,000 impressions and 240 engagements.
That's 2% by impressions and 0.48% by followers. A healthy impression rate next to a weak follower rate usually means the content works for the people who see it, but a large share of the follower list never sees it or never acts on it. In most audits, that gap traces back to inactive and fake accounts.
Replies deserve extra attention in either calculation. A like ends the interaction. A reply is a new post that other people can see and answer, so a post with 40 replies often keeps collecting impressions long after a post with 400 likes has stalled.
Audit your posts
Export the last 30 to 60 days of posts from X's analytics dashboard, with impressions and engagements for each one, and calculate the impression-based rate per post. Then sort the sheet a few different ways:
- Group posts by format (text, thread, image, video, link), by topic, and by the hour they went out.
- Pull your top 10% and bottom 10% and read them side by side.
- Give replies their own column instead of folding them into total engagements.
- Track a weekly moving average, so one post that took off doesn't hide a slow decline in everything else.
In most accounts, two or three formats carry nearly all the replies. Those are the formats to build the next month around.
A small streetwear shop that prints its designs on blank t-shirts might find that short clips of a press run earn far more replies than polished product photos. In that case, weekly press-run clips belong at the center of next month's plan.
Audit your audience in Circleboom
Post data shows what works. It doesn't show who you're working with. For that, Circleboom's Twitter Tool breaks your follower list into the accounts that engage, the accounts that don't, and the accounts that were never real.
One caveat before the steps. Removing dead followers won't lift your impression-based rate by itself, because inactive accounts rarely load a feed in the first place. What the cleanup does fix is the follower-based rate that brands and partners check, and it tells you how large your working audience actually is.
Run the X Account Analysis Report
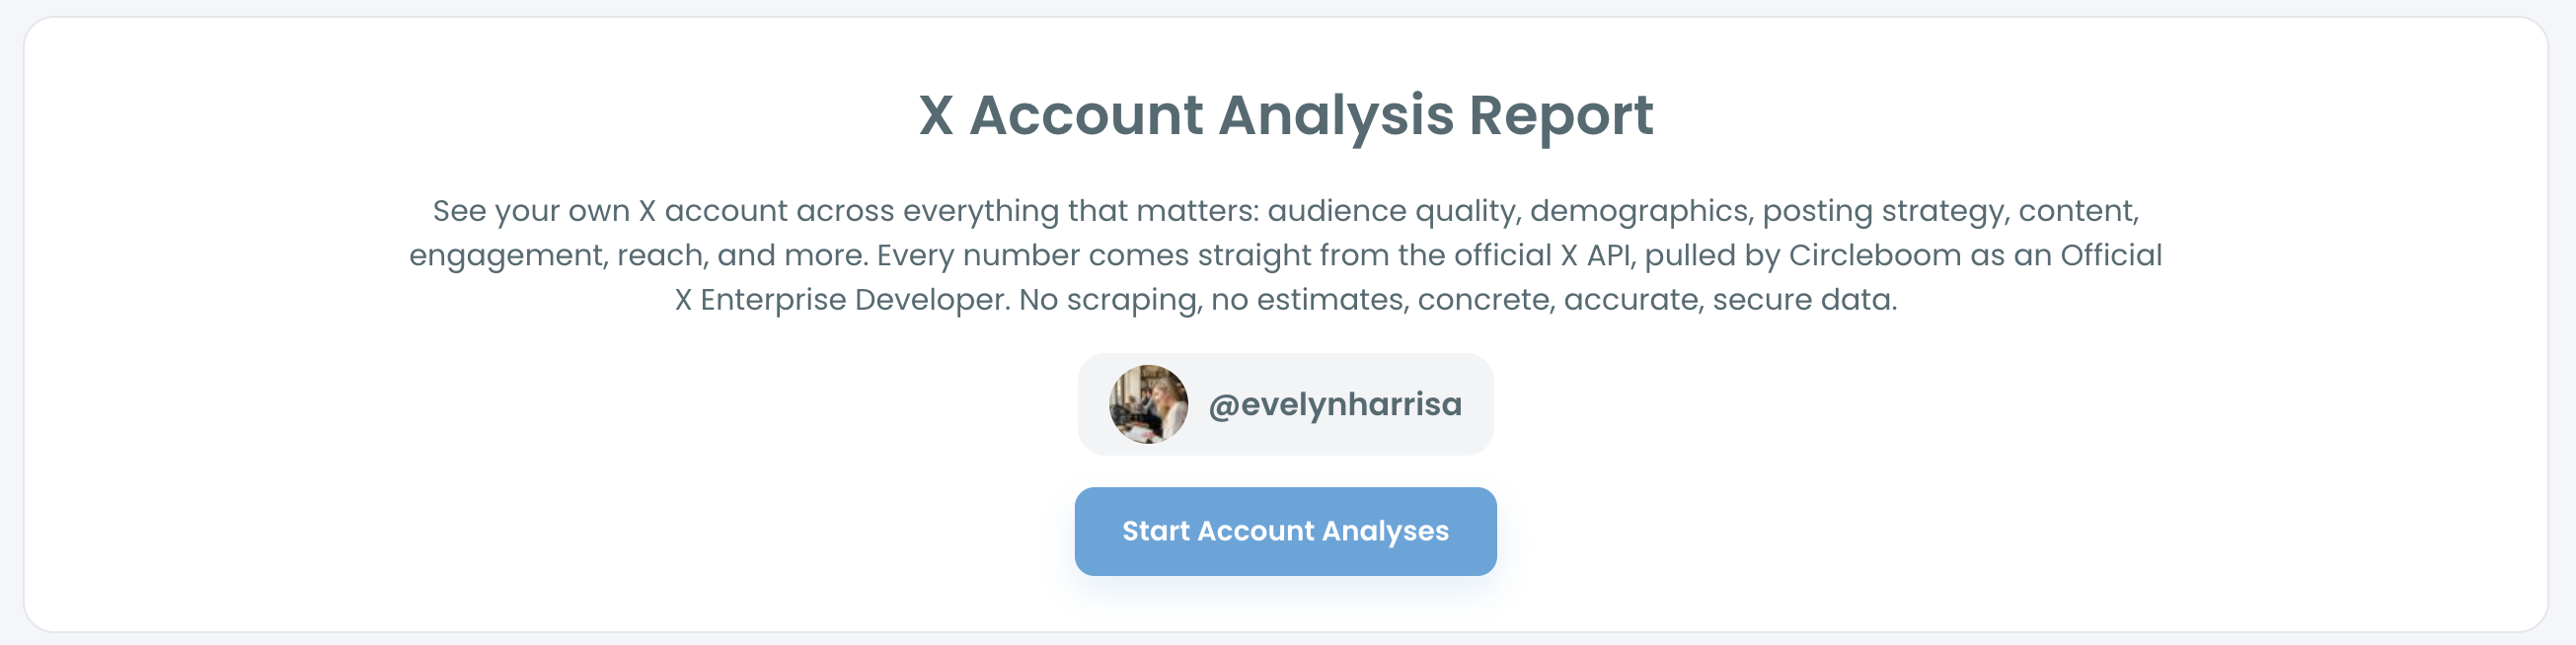
Enter any handle, your own or someone else's, and the report covers audience quality, demographics, posting strategy, content, engagement, and reach. Circleboom pulls the data from the official X API as an Official X Enterprise Developer, so every number comes from X itself.
Run it on two or three accounts in your niche as well as your own. An account with half your followers and twice your reply volume is the clearest picture of what X's ranking model is rewarding in your category.
Sort the full follower list
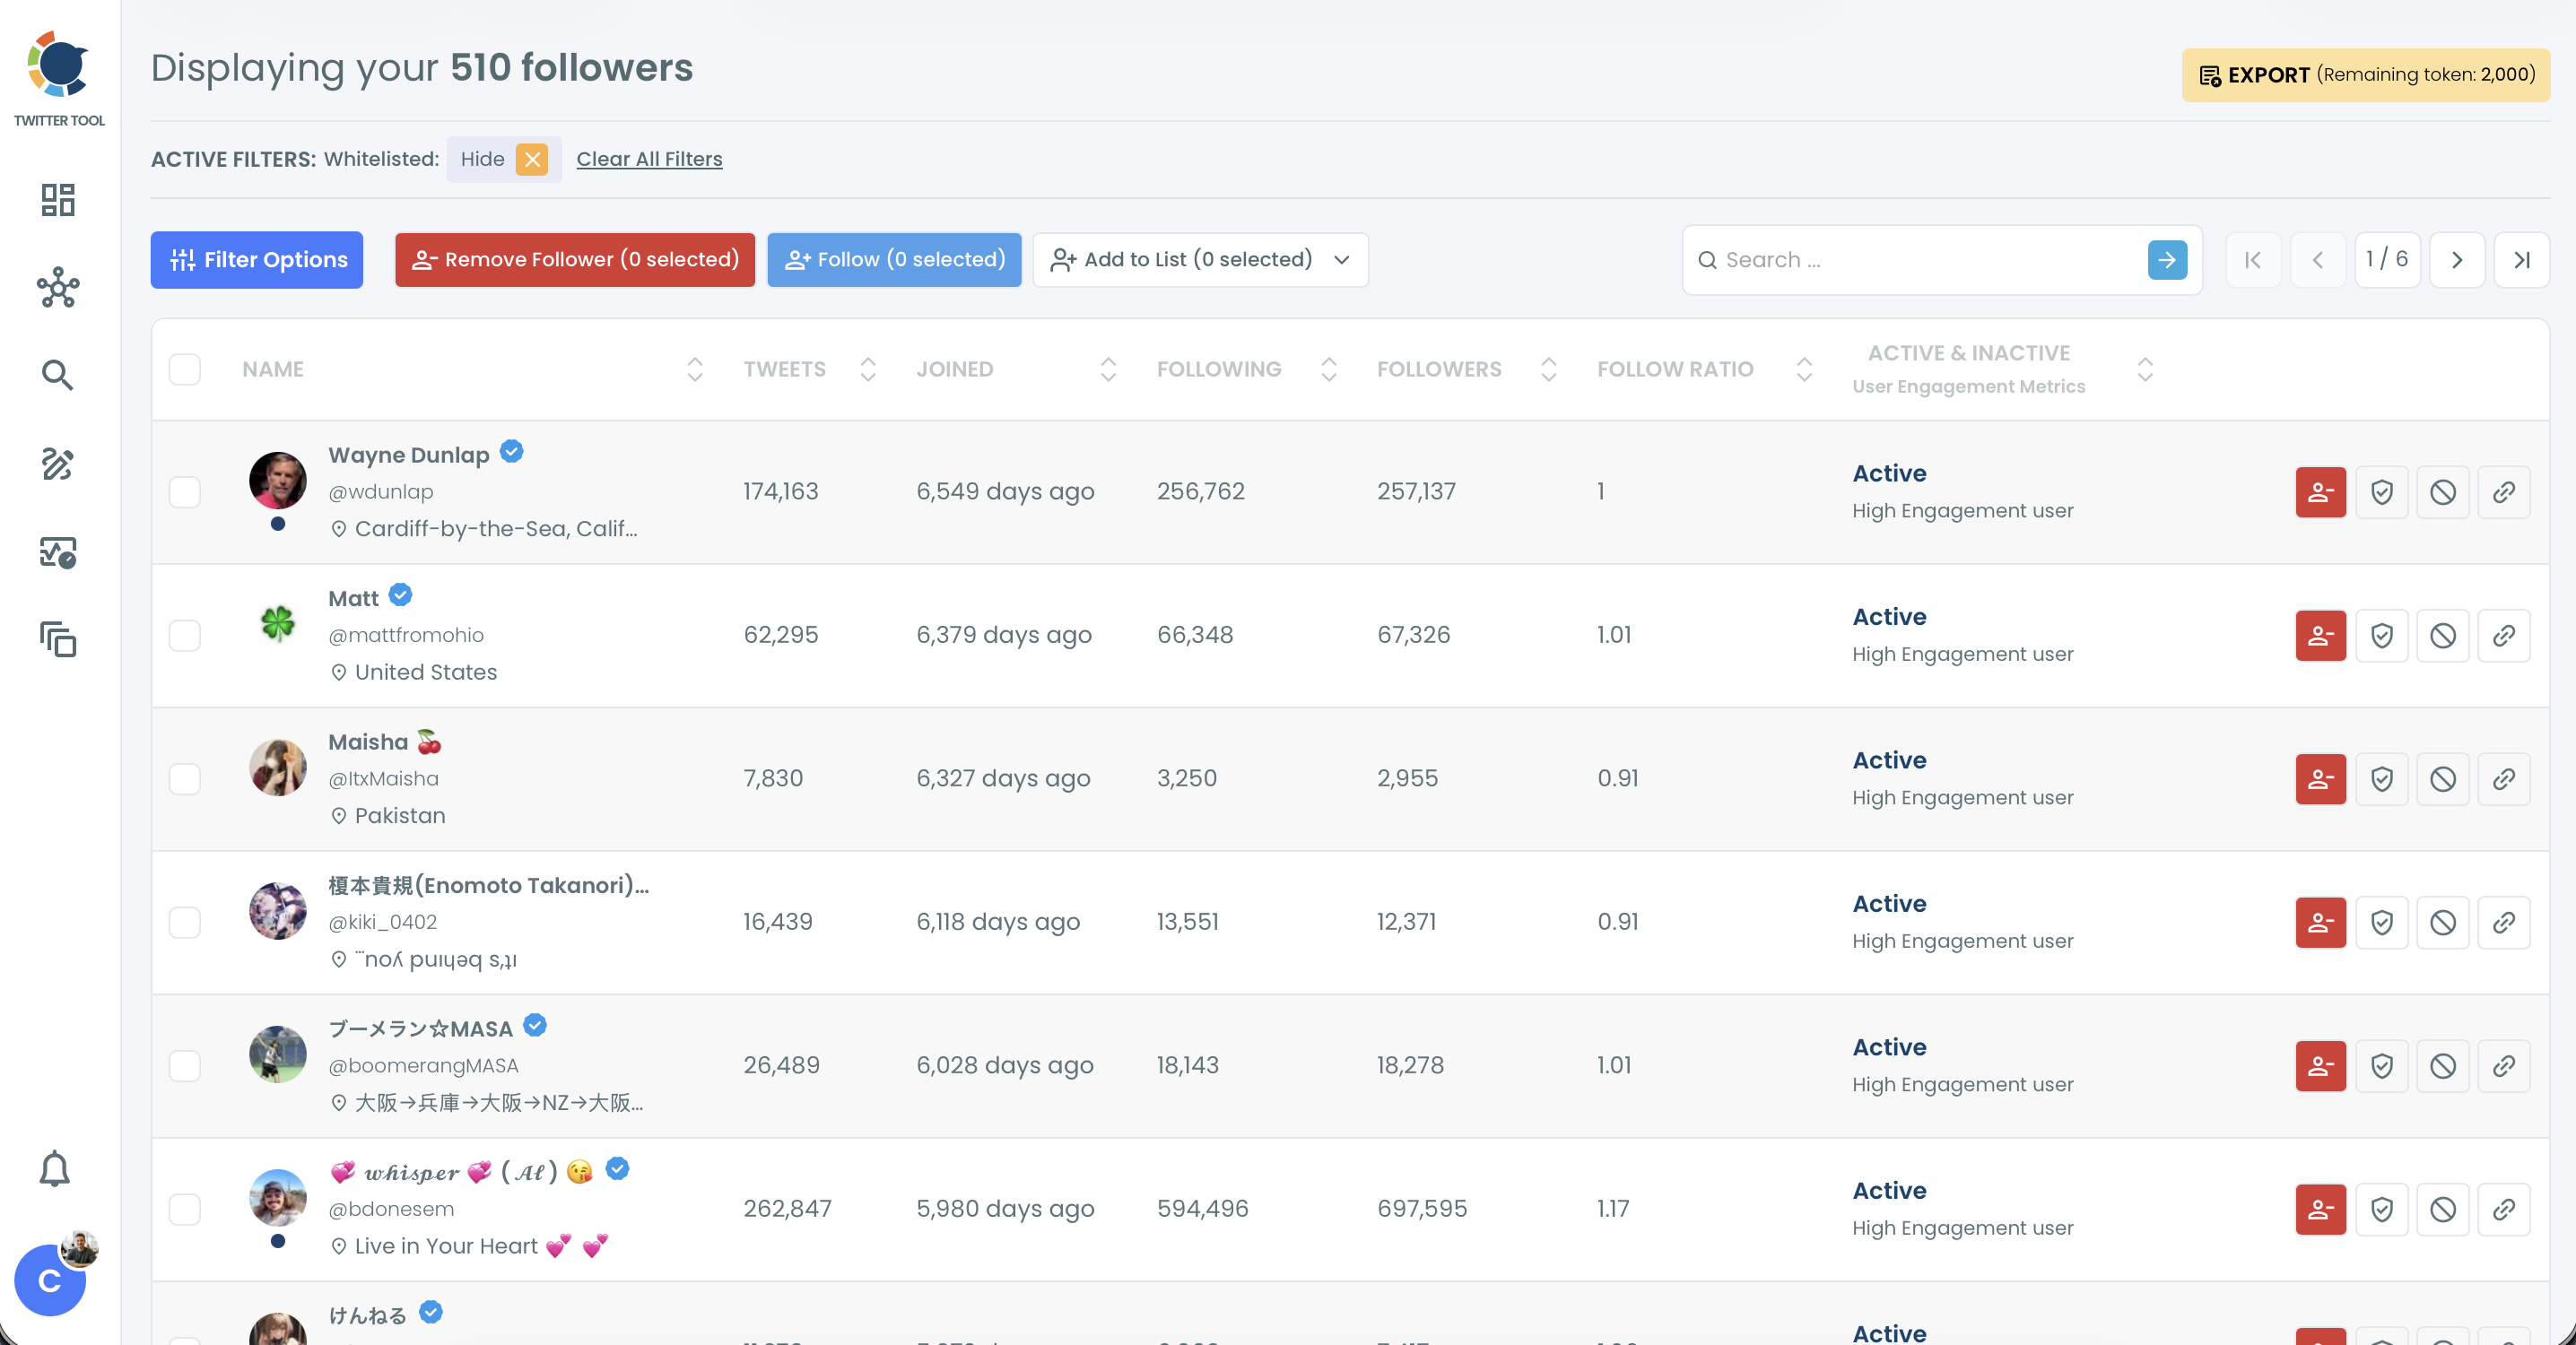
The main follower view lists every account with its tweet count, join date, following, followers, follow ratio, and engagement activity. Each column is sortable.
Sort by tweets, lowest first. Accounts like one in this list, with 8 tweets across 3,132 days, float to the top within seconds.
Separate inactive accounts from fake ones
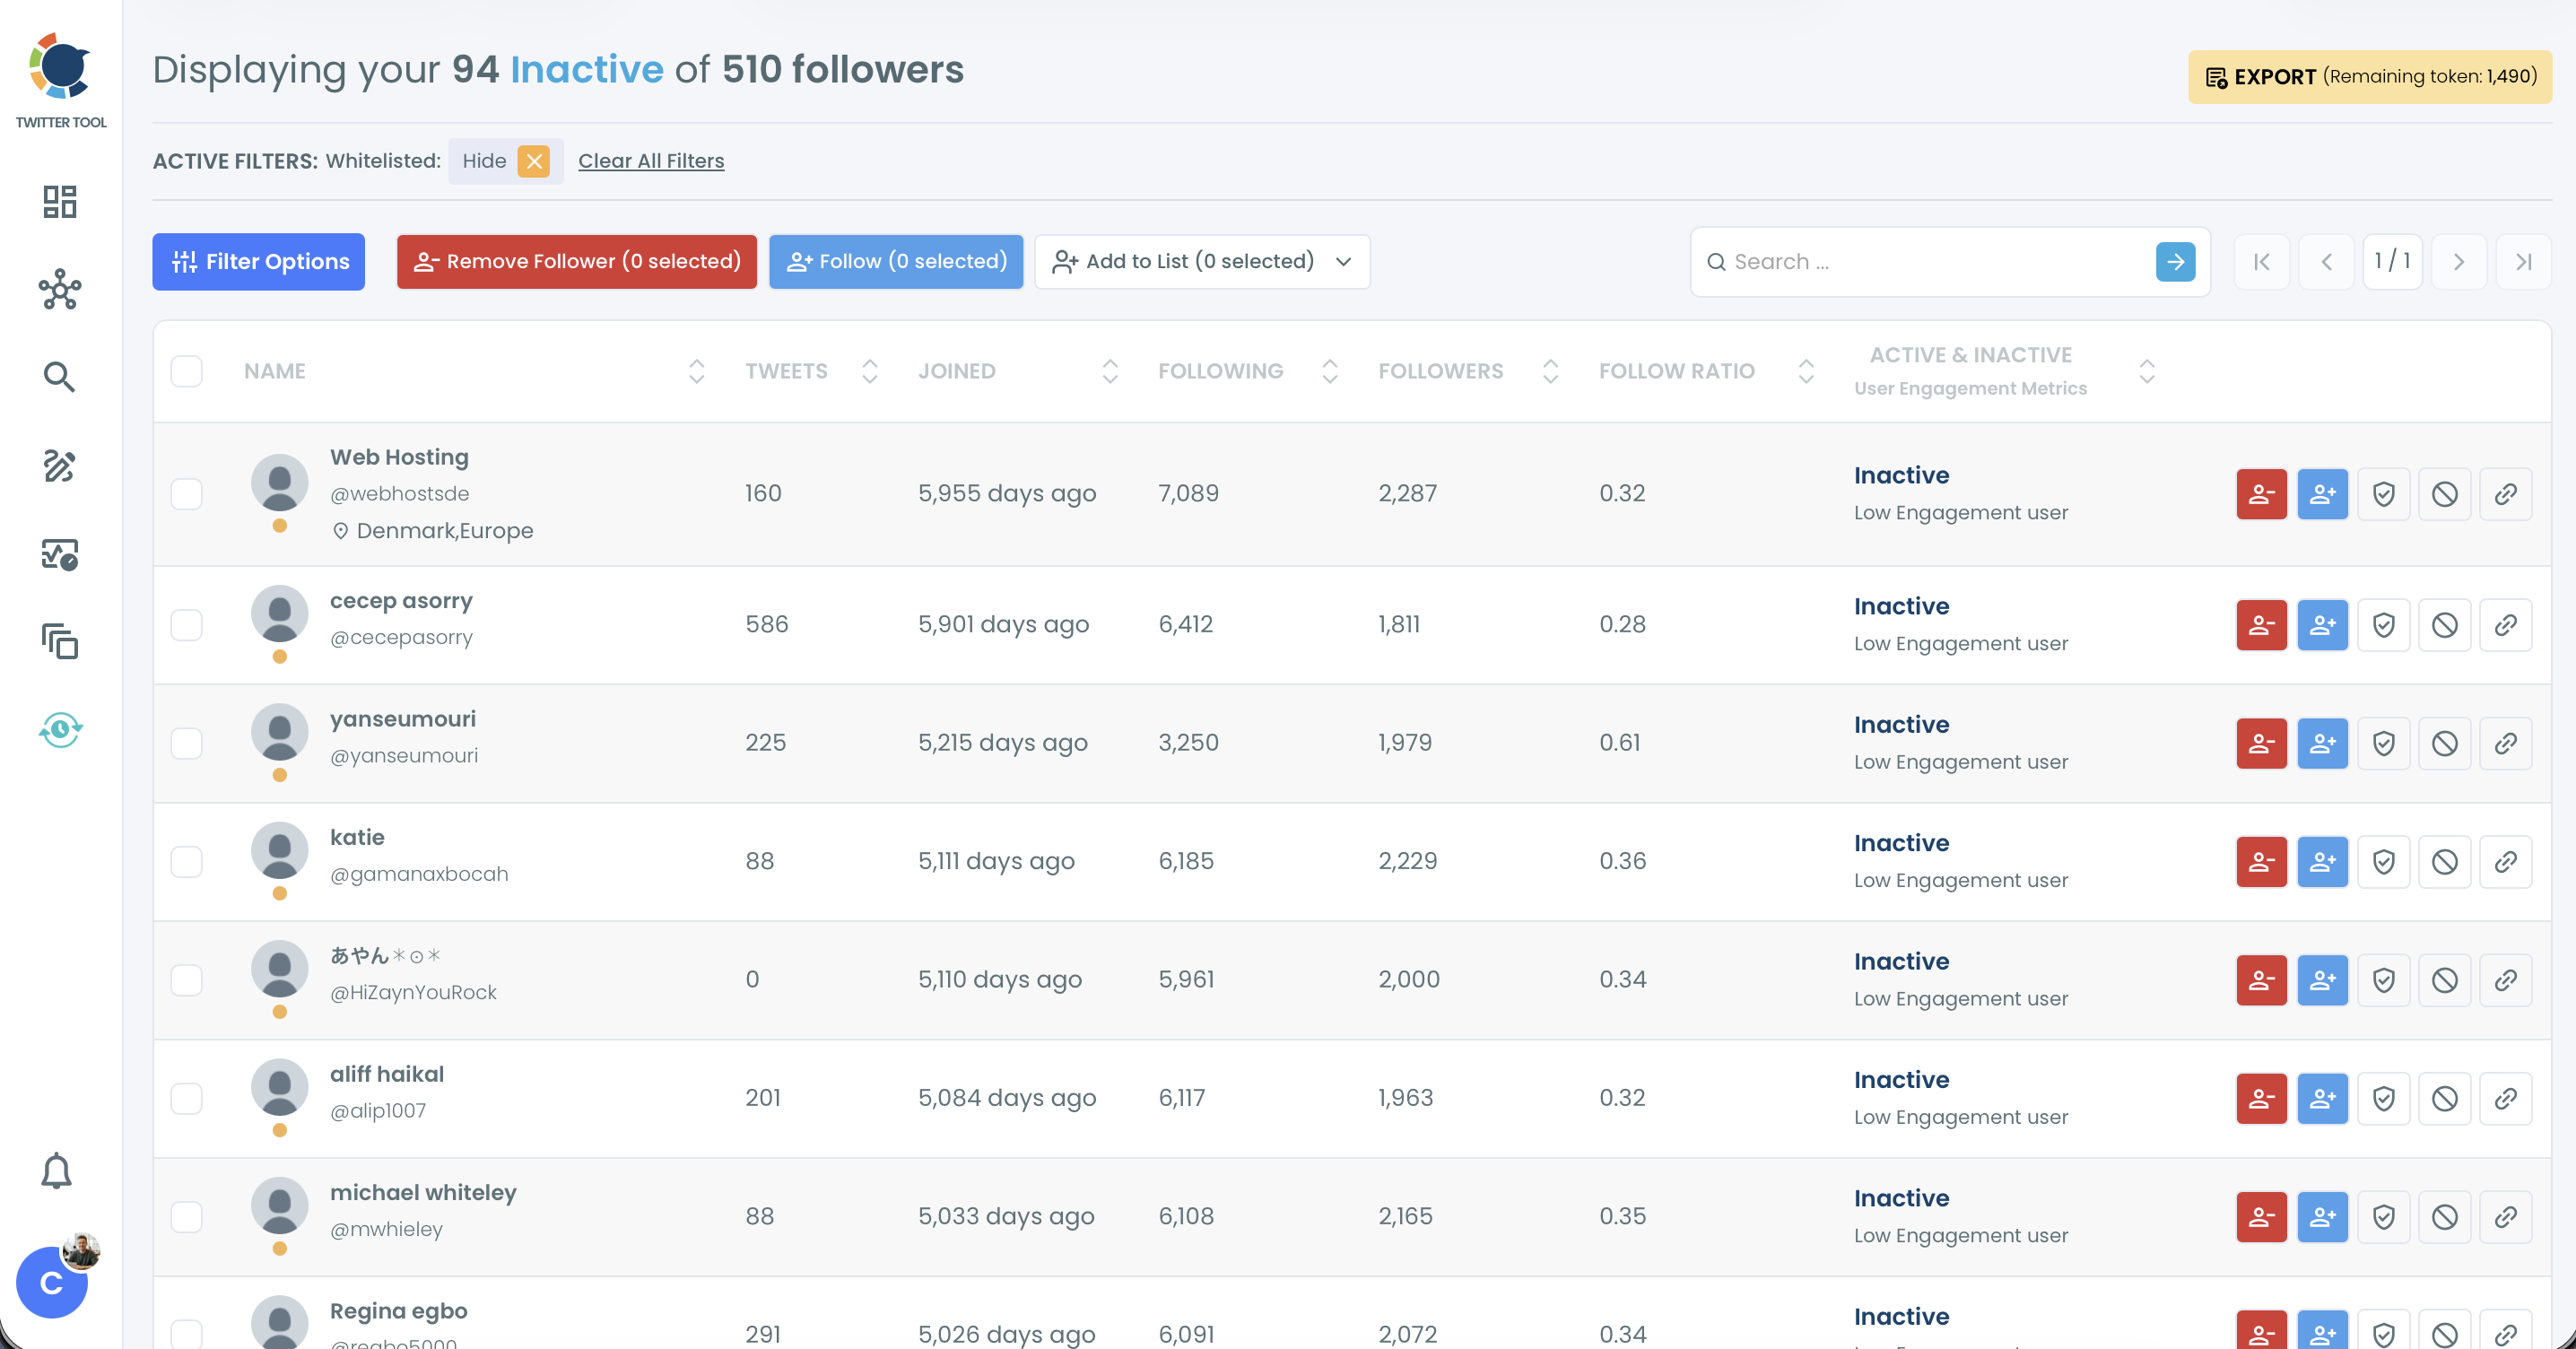
Circleboom judges inactivity by account age and total tweets. An account counts as inactive if it has gone a year without activity, or if it only posts sporadically.
Many of these are real people who read and rarely post, so review them before removing anything. A dormant follower who works at a company you sell to can be worth keeping.
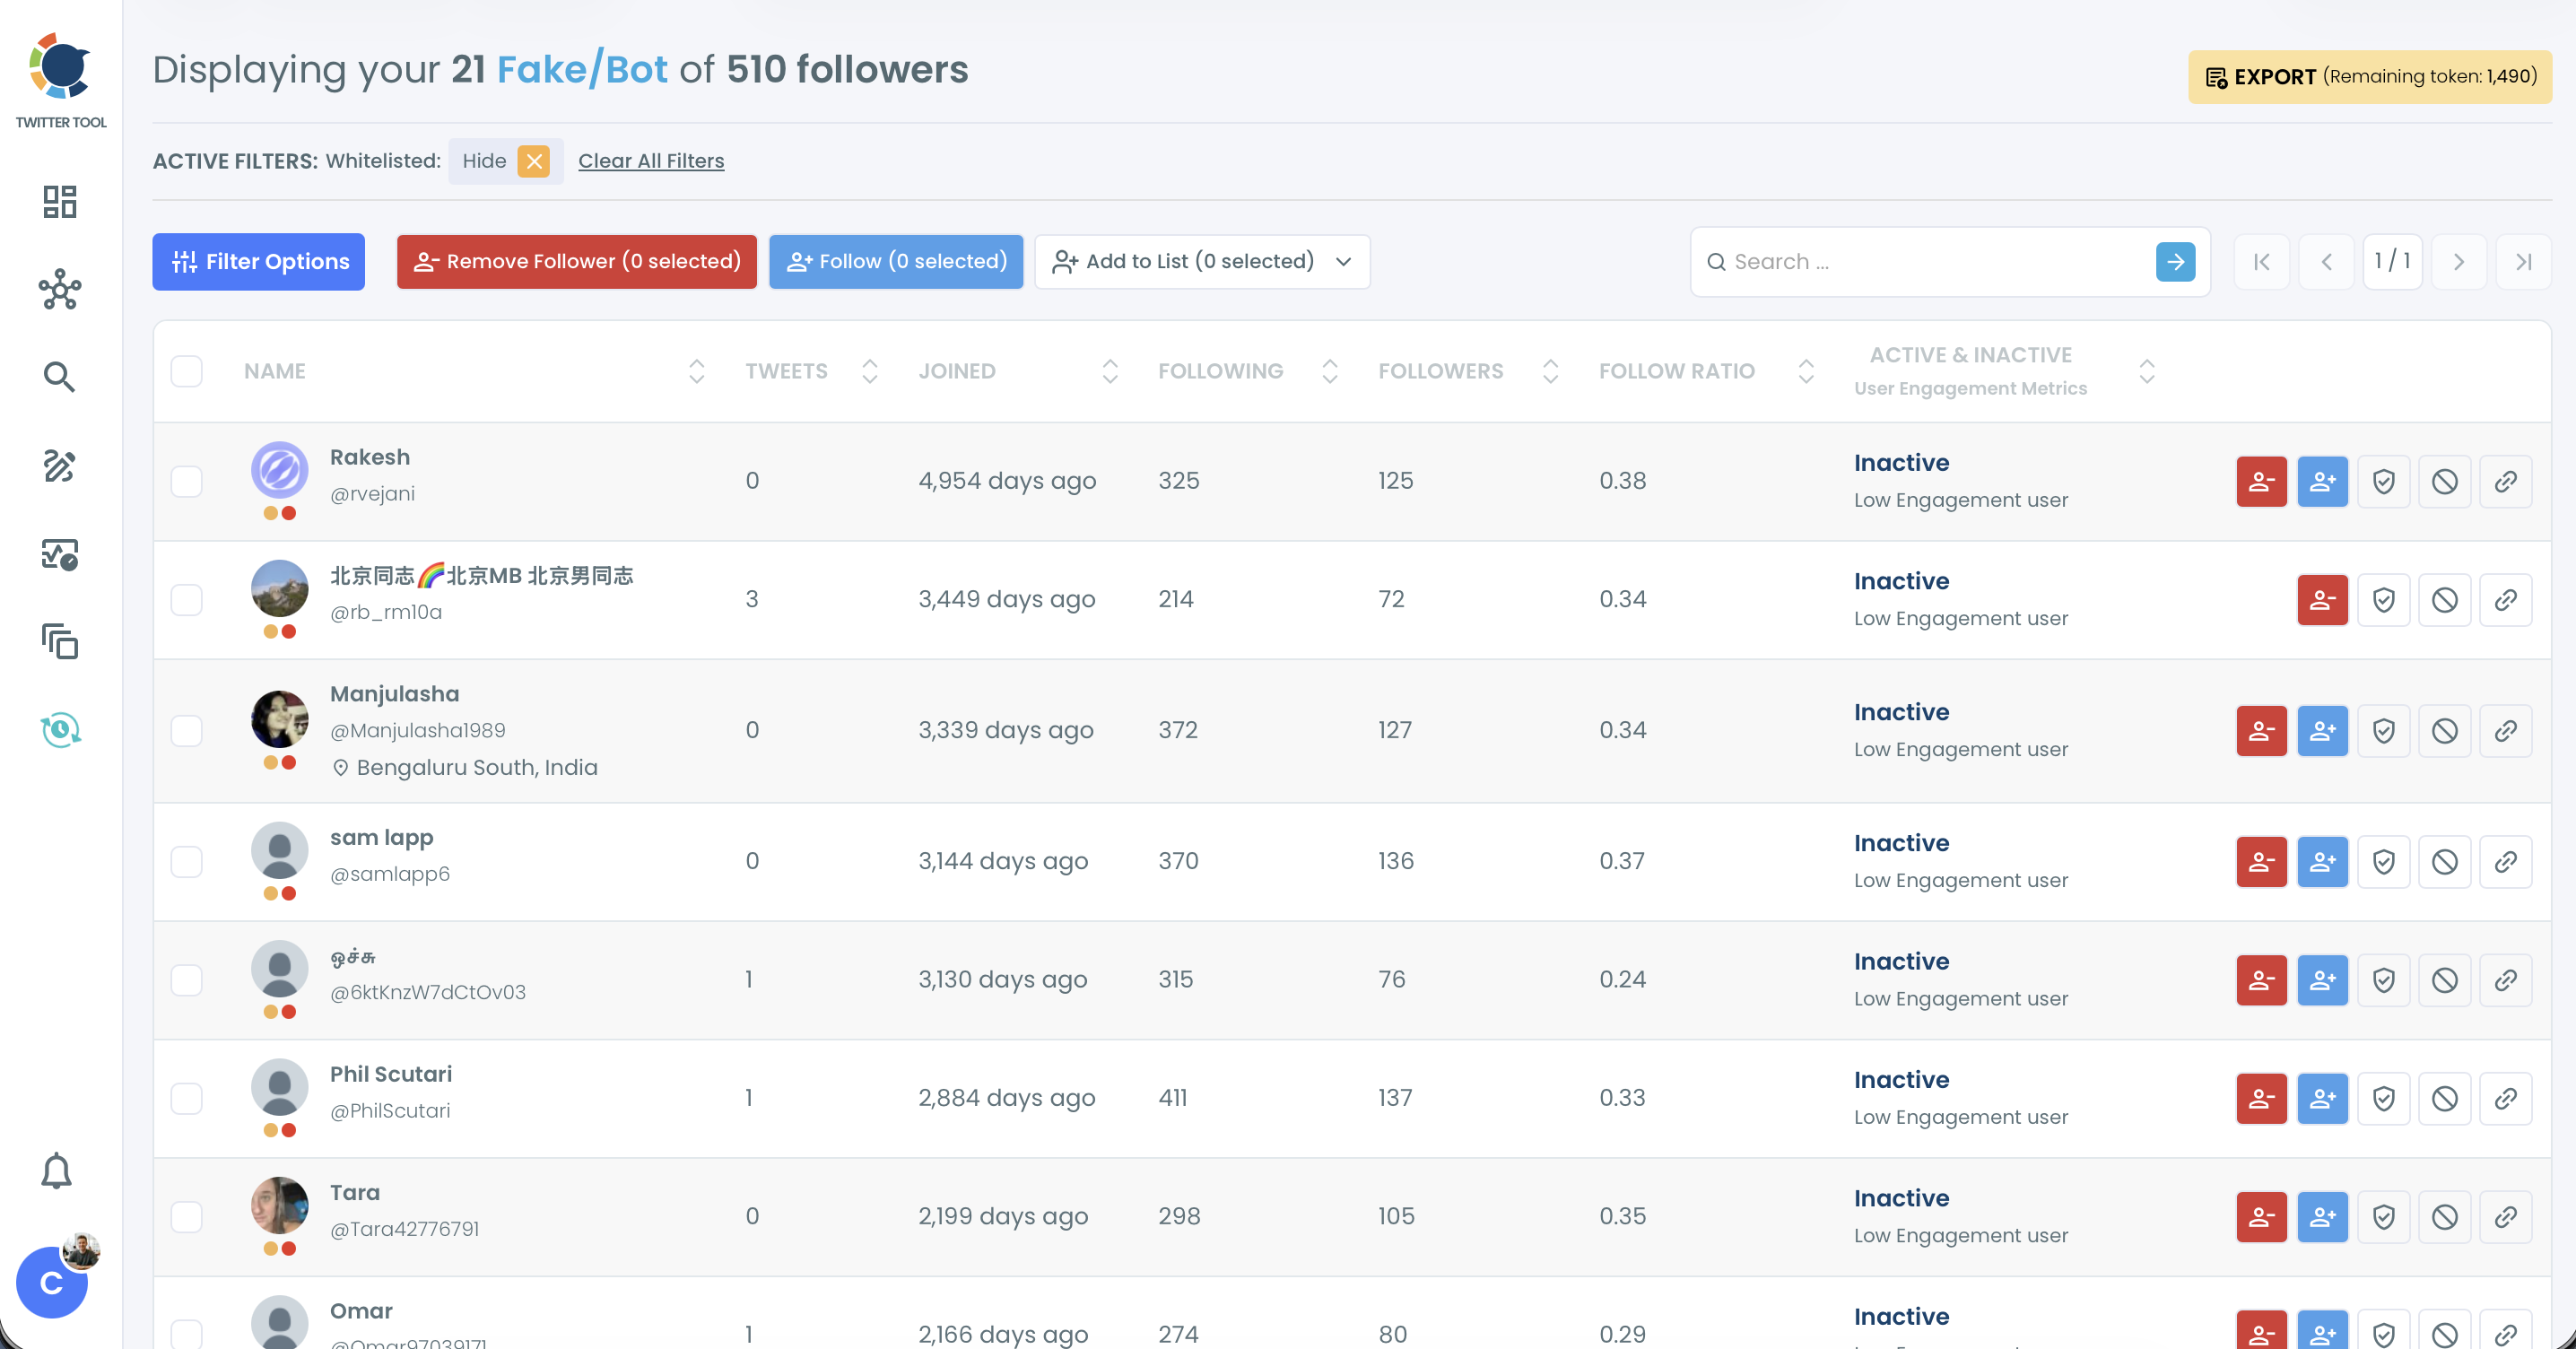
The Fake/Bot list is simpler. One account here follows 170,465 accounts. Nobody reads a timeline that size, and an account like that adds nothing to your follower-based rate.
Review low-quality followers
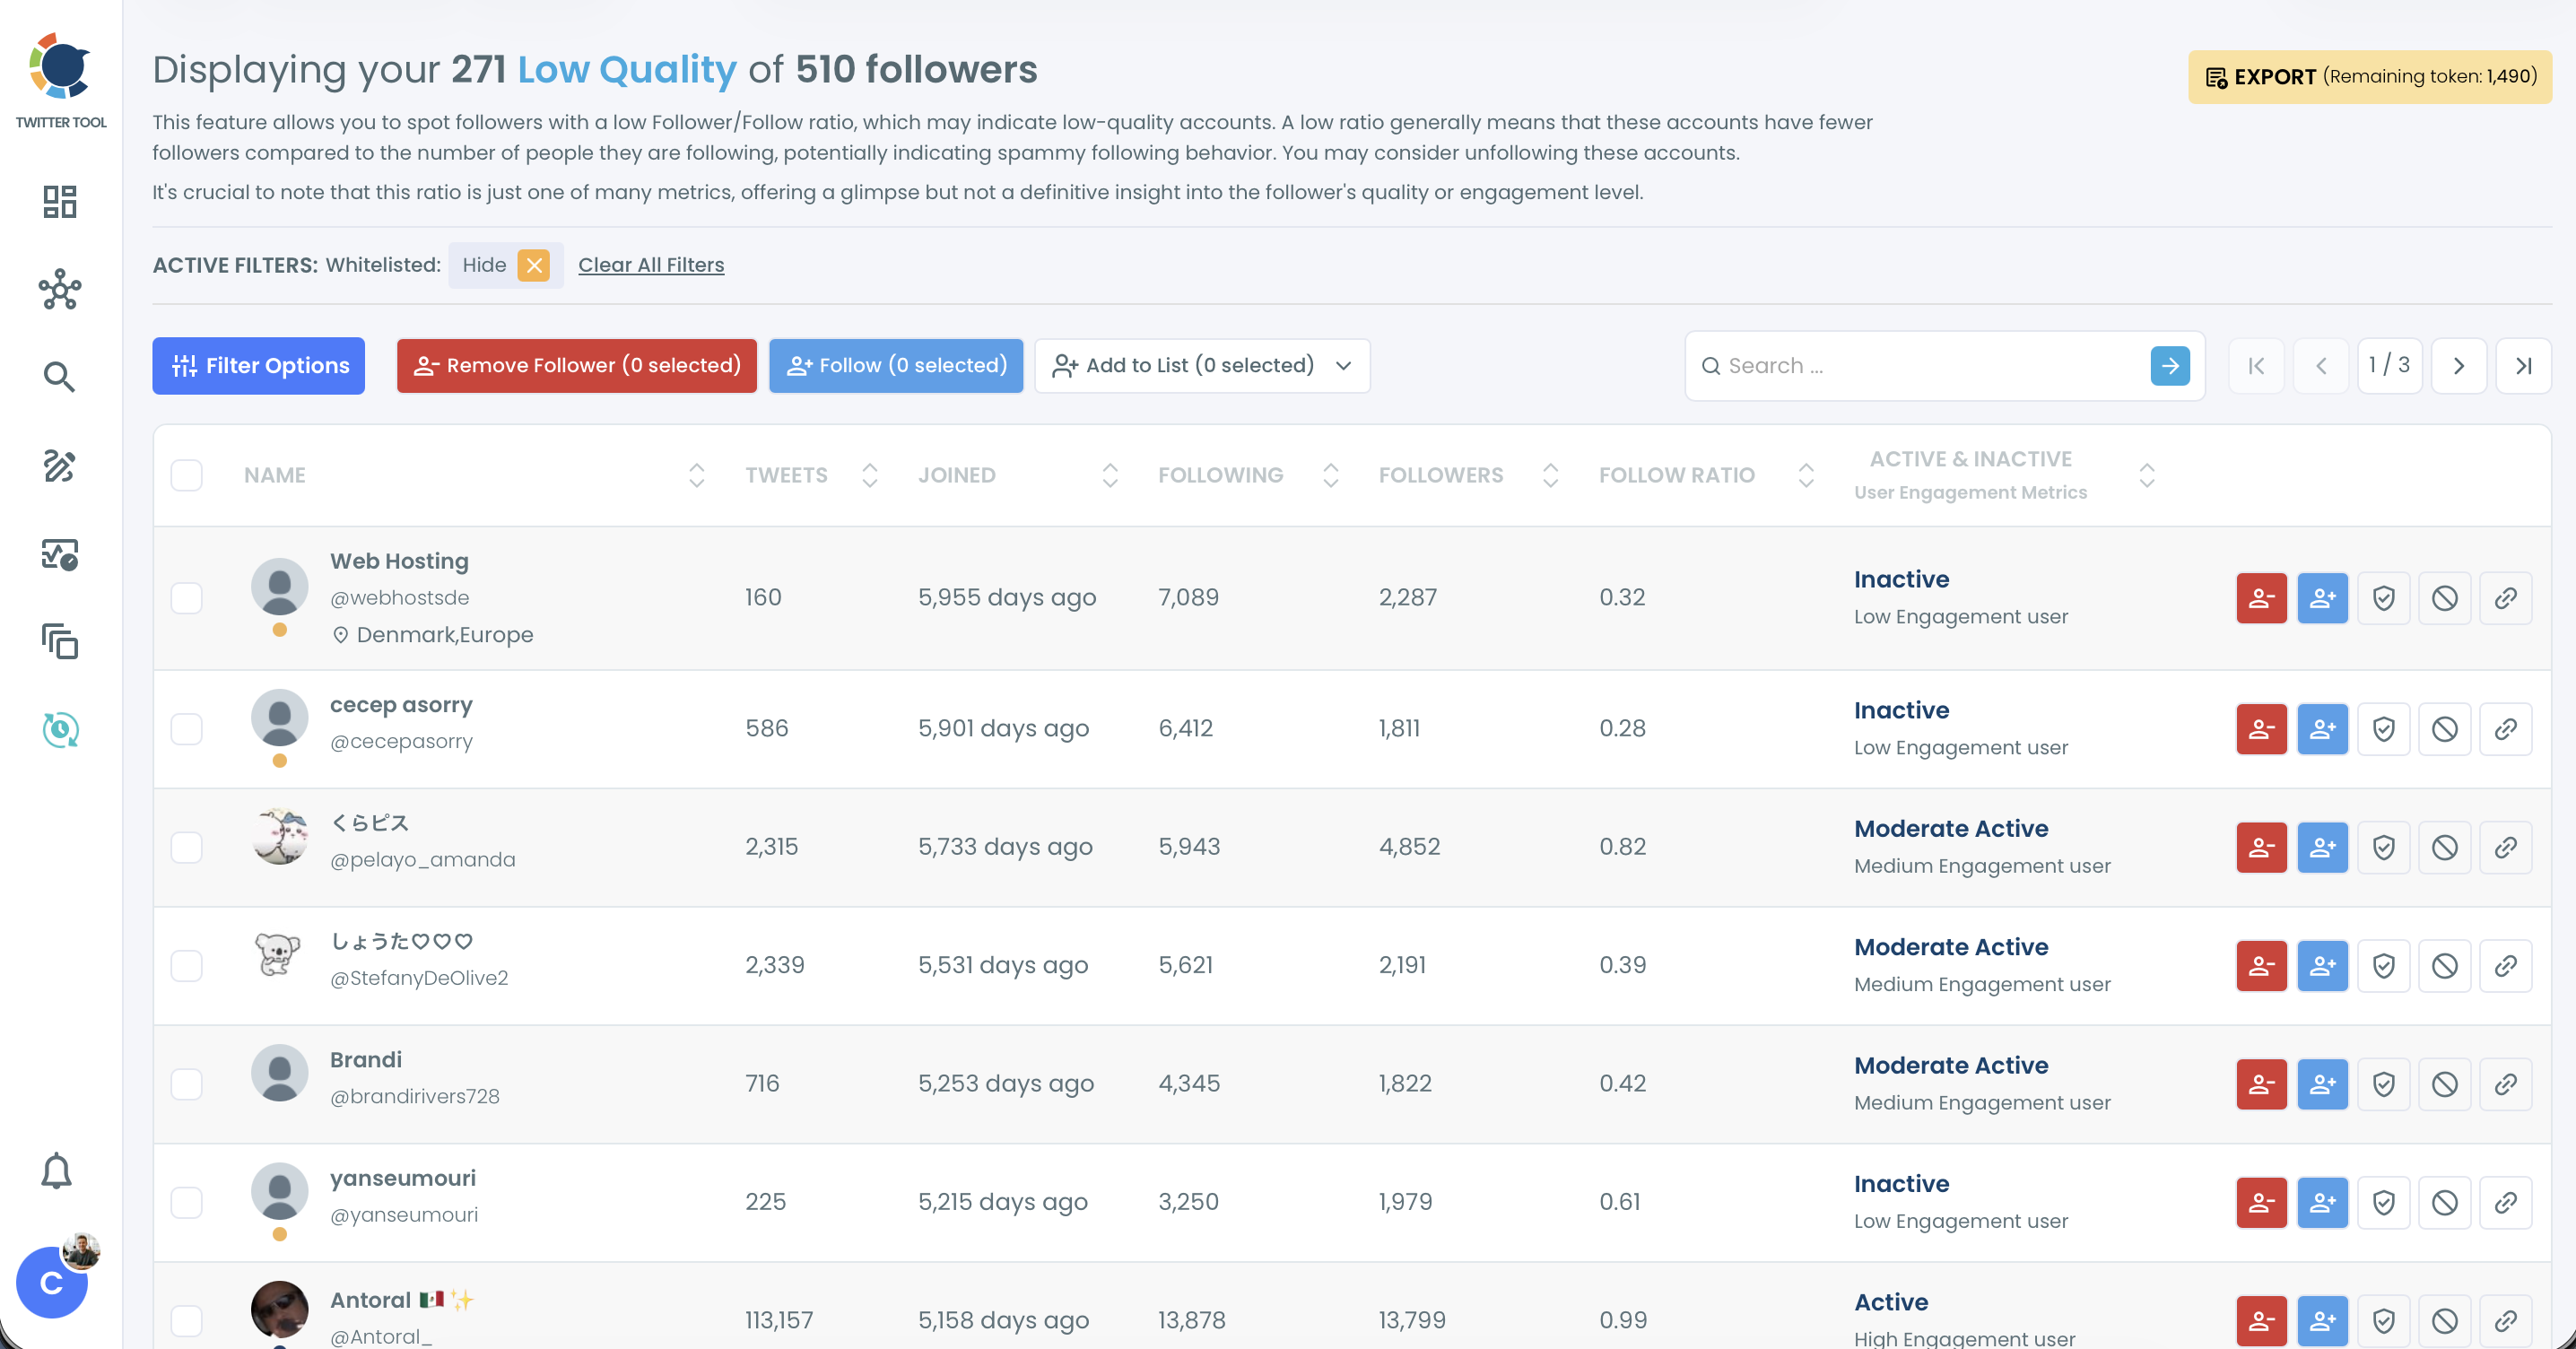
This list flags followers with a low follower-to-following ratio, which often points to spam-style following. Circleboom treats the ratio as one signal among several, so scan each account before you remove it.
Before any bulk removal, click the shield icon on accounts you want to protect, such as clients, teammates, and partners. Whitelisted accounts drop out of every list, and the Remove Follower button handles the rest in bulk.
Find the followers who already engage
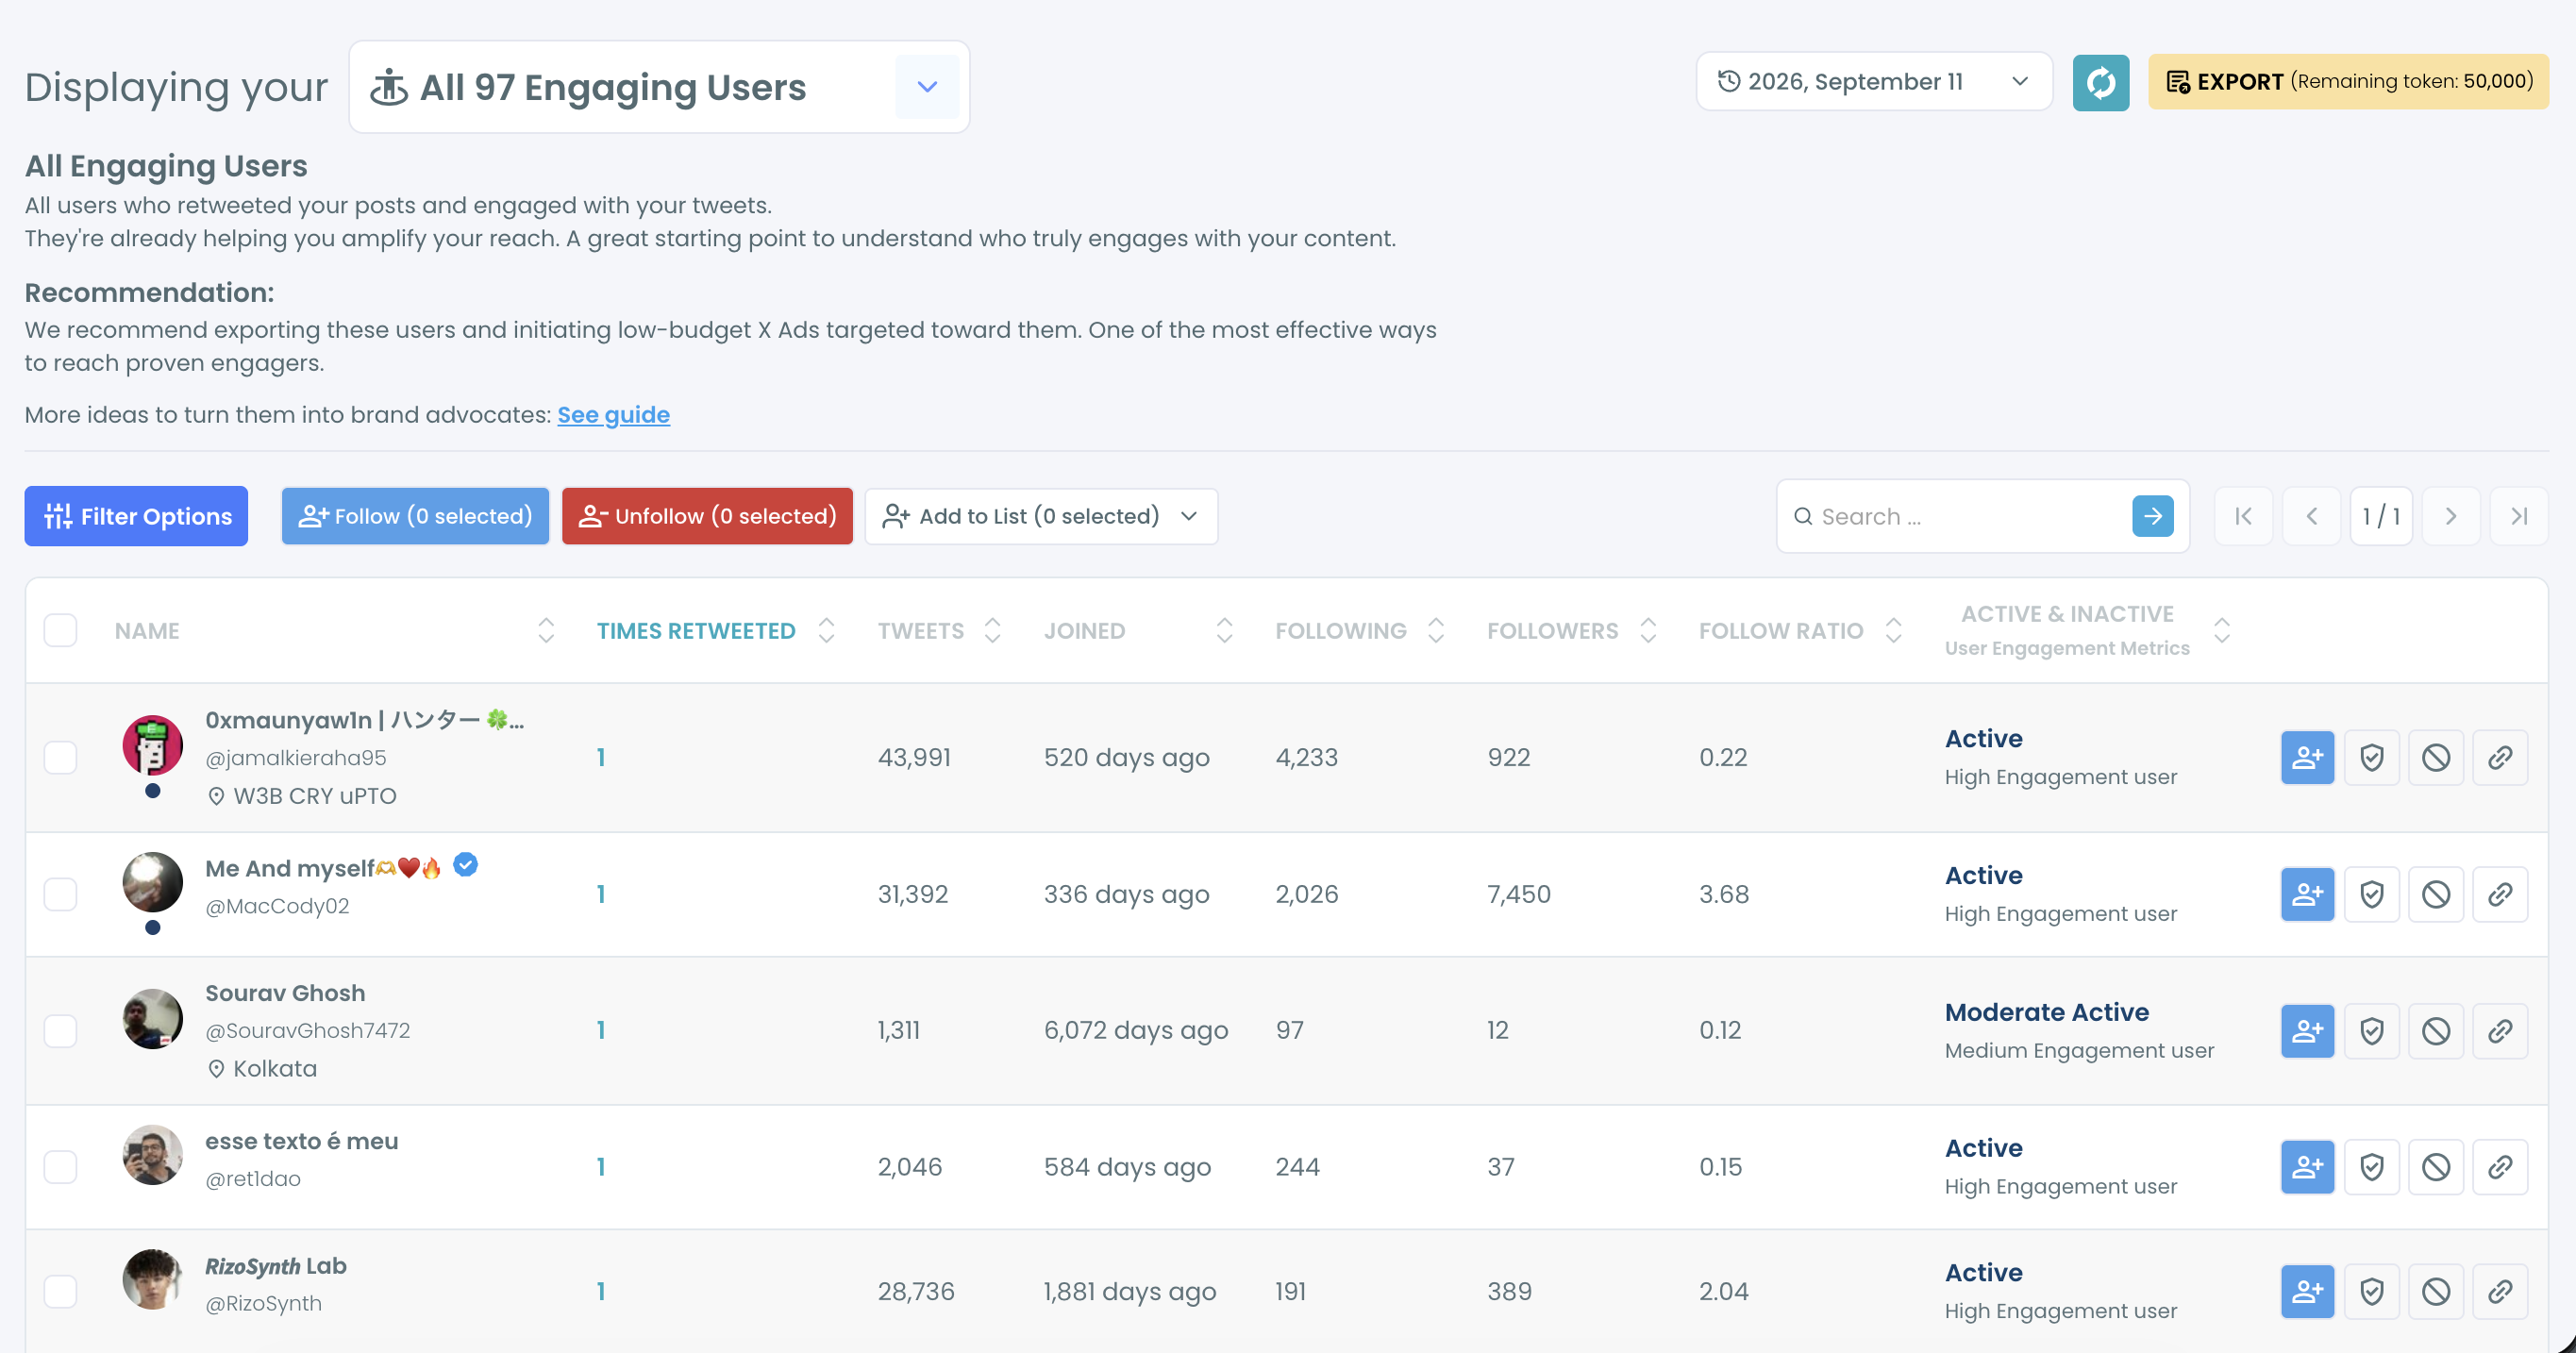
This is the most useful list in the tool for an engagement-ranked feed.
Engaging & Loyal Followers pulls up to your last 3,200 tweets, finds the accounts that consistently retweet and engage with your posts, and shows which of them follow you. These are the people whose early replies tell X's model that a post is worth showing to more people. On a typical account, the list is short. Fifty or sixty names can account for most of the replies that get a post moving.
Know who they are. Reply to them first. Notice what they respond to, and post more of it.
Write posts people answer
Once you know which formats earn replies and who your engaged followers are, the next month of content mostly plans itself. A few habits do most of the work:
- Ask one specific question. "Thoughts?" gets nothing. "Which of these three onboarding emails would you cut first?" gets answers, because the reader can reply in five words.
- Leave threads open at the end. A short thread that closes with a gap ("What would you add for a team under ten people?") pulls in additions from people who know the topic.
- Reply within the first hour. Every reply you write is another post in the conversation, and it gives the person who commented a reason to answer back.
- Use media that stops the scroll. Native video clips, a single clean chart, or one striking image outperform a bare link on most accounts.
Echo Mao, Head of Marketing at AIReel, an AI video generation platform that turns text prompts and images into short videos, sees the same pattern in short-form video on X.
She says, "Short native video earns replies when it leaves the viewer something to decide. The clips that get people talking are under 30 seconds and end open, like two versions of the same scene and a question about which one works better. A polished clip that wraps everything up gets watched and scrolled past. Leave the last call to the viewer, and the replies do the distribution."
Outside your own feed, X Spaces and Communities put you in rooms where replying is the default behavior. A weekly Space or a regular presence in two or three relevant Communities builds the same group of repeat engagers that shows up in your Engaging & Loyal list a month later.
The brand accounts that do well on X tend to follow one of three patterns: fast, funny replies (food and consumer brands), access people can't get elsewhere (live mission updates from NASA, sports teams during games), or service (B2B accounts that solve problems in their replies). Each one is built on a reason to respond, and each one shows up on the same schedule every week.
Before the next update
X's code changes every four weeks, so the audit works best on the same rhythm. Block an hour after each update to read the developer notes, pull the last four weeks of post data, and rerun the X Account Analysis Report on your account and the two or three you benchmark against.
If your reply count holds steady across an update, the formats you're using still fit the model. If it drops, check the Engaging & Loyal list first. A change in who responds usually shows up there a week or two before it shows up in impressions.
Circleboom's Twitter Tool shows which followers engage, which have stopped posting, and which were never real, with data pulled from the official X API. Run your X Account Analysis Report on Circleboom before X's next update, then open your Engaging & Loyal Followers list to see who keeps your posts moving.

