
Why does an X creator payout drop when nothing about your posting seems to have changed? There are six usual causes, two on X's side and four inside your own account, and each one leaves a different mark on your post metrics.
An X creator payout usually drops for one of six reasons: X changed the programme, some posts stopped qualifying, fewer people saw your posts, fewer people responded, you posted less, or the previous period held one outsized post. Circleboom compares your post metrics on X for one period with the period before it, using official Enterprise APIs, so you can see which reason applies.
→ X creator payout
The causes follow in the order worth checking, each with the metric that reveals it.
Is your X payout lower, or did it not arrive?
A lower payout and a missing payout are two different problems, and only the first one is about your posts. Sort yourself into one of the two before reading further, because the fixes do not overlap.
The payout arrived and is smaller than the last one. Something changed in what X counted between two periods. That is a measurement question, and the rest of this article answers it.
The payout never arrived. Nothing was paid, so there is no figure to compare. That points to payment setup, account status or eligibility, and the steps for what to do if an X payout is not received are a separate checklist. Post analytics cannot find a payment that was never sent.
Platform-side causes: what X changed about creator payouts
Two causes sit on X's side, and neither shows up in your own metrics. Check them first, because no change to your content will fix a rule change.
X replaced Creator Revenue Sharing with a different programme
X retired Creator Revenue Sharing and moved creators to a newer rewards programme with its own eligibility bar and its own way of counting. X's help page for Creator Revenue Sharing records the earlier programme's requirements and its retirement. If the drop in your X creator payout lines up with that handover, compare the dates first.
The practical effect is that two payouts on either side of the switch were not measured the same way. A creator whose audience and output stayed level can still see a different amount, because the yardstick moved.
Some posts stopped qualifying under X's standards
Posts that fall outside X's rules for monetized content do not earn, however many people see them. X's Creator Monetization Standards describe the content that is not eligible, and they are the reference to read when a payout is reduced or withheld.
This cause is easy to miss, because the post still looks healthy. Its impressions and likes appear in every analytics view as usual. It simply adds nothing to the payment.
I have not found a fixed price per impression on X's help pages that a creator can multiply out. A revenue sharing payout calculator can give a ballpark figure, but your own previous period remains the only firm baseline.
Account-side causes of a lower Twitter payout
Four causes sit inside your own account, and all four are visible in post metrics. Circleboom reads the post metrics of your Twitter account period by period, so each cause behind a lower X creator payout can be told apart from the others.
The fastest way to separate them is to check your X creator earnings period against the one before it. The payout period sits on one side and the preceding period on the other.
Fewer people saw your posts
Fewer impressions in the period means fewer chances to earn. The total can fall because the algorithm showed your posts less, because you posted at weaker hours, or because the account's visibility is limited.
On the cards this cause is the plainest to read: Impressions carries a red arrow, and most other metrics follow it down by a similar share. When everything shrinks together, reach is the common factor. Timing is worth ruling out early, since a shift in publishing hours can change reach with no change in content.
People saw your posts but responded less
Impressions can hold while engagements fall. That pattern says the audience is still being shown your posts and is passing them by.
The cards show it as a split. Impressions sits near gray or green while Engagements, Replies, Reposts or Bookmarks turn red. Note which of those fell hardest. A drop in replies points to less conversation, and a drop in reposts points to less sharing, which are different weaknesses with different fixes.
You published fewer posts
A period total is a sum, and a sum shrinks when fewer posts feed it. Posting less is the most ordinary cause on this list and the one creators overlook most often, because each individual post still looks normal.
No single card proves this cause. Every total falls by a similar share, which looks like a reach problem at first glance. The difference appears only when you count the posts in each period and find that the average per post did not move.
One standout post inflated the previous period
A single viral post can lift a whole period. The next period then looks like a decline when it is a return to your usual level. In this case nothing got worse. The earlier payout was the exception.
The chart exposes this one faster than the cards do. Widen the range to 3 months and look at the stretch before the payout period. A single tall spike with ordinary days on both sides is a standout post. A broad plateau that later sinks is a real decline. Then open the week that broke the trend and see which post or format sat behind it.
How Circleboom shows which metric fell on X
Circleboom's Post Analytics Overview puts a payout period and the equal period before it on one screen. Every post metric gets a total for the range you select and a percentage change against the preceding range of the same length. The data behind it is the per-post analytics of the connected X account, which Circleboom groups by day into a chart with a row of cards under it.
The trust question matters here, since you are connecting an account that earns money. Circleboom is an official X Enterprise developer, which means the numbers come through X's sanctioned data access, and no scraping touches your account.
To run the comparison, open Circleboom Twitter, go to Post Analytics and load the Overview. Then make a falling X creator payout readable in four moves.

Set the range to the payout period
The range buttons at the top right cover 7 days, 2 weeks, 4 weeks, 3 months and 1 year, and the calendar icon opens a custom range. Choose the dates that match the period you were paid for. The cards then compare that period with the equal stretch right before it. There is no setting to pick a different baseline.
Read the cards in pairs
Each summary card shows a metric's total and its change, with a green arrow for an increase, a red arrow for a decrease and a gray arrow for no change. Read Impressions with Engagements. Together they separate a visibility problem from a response problem.
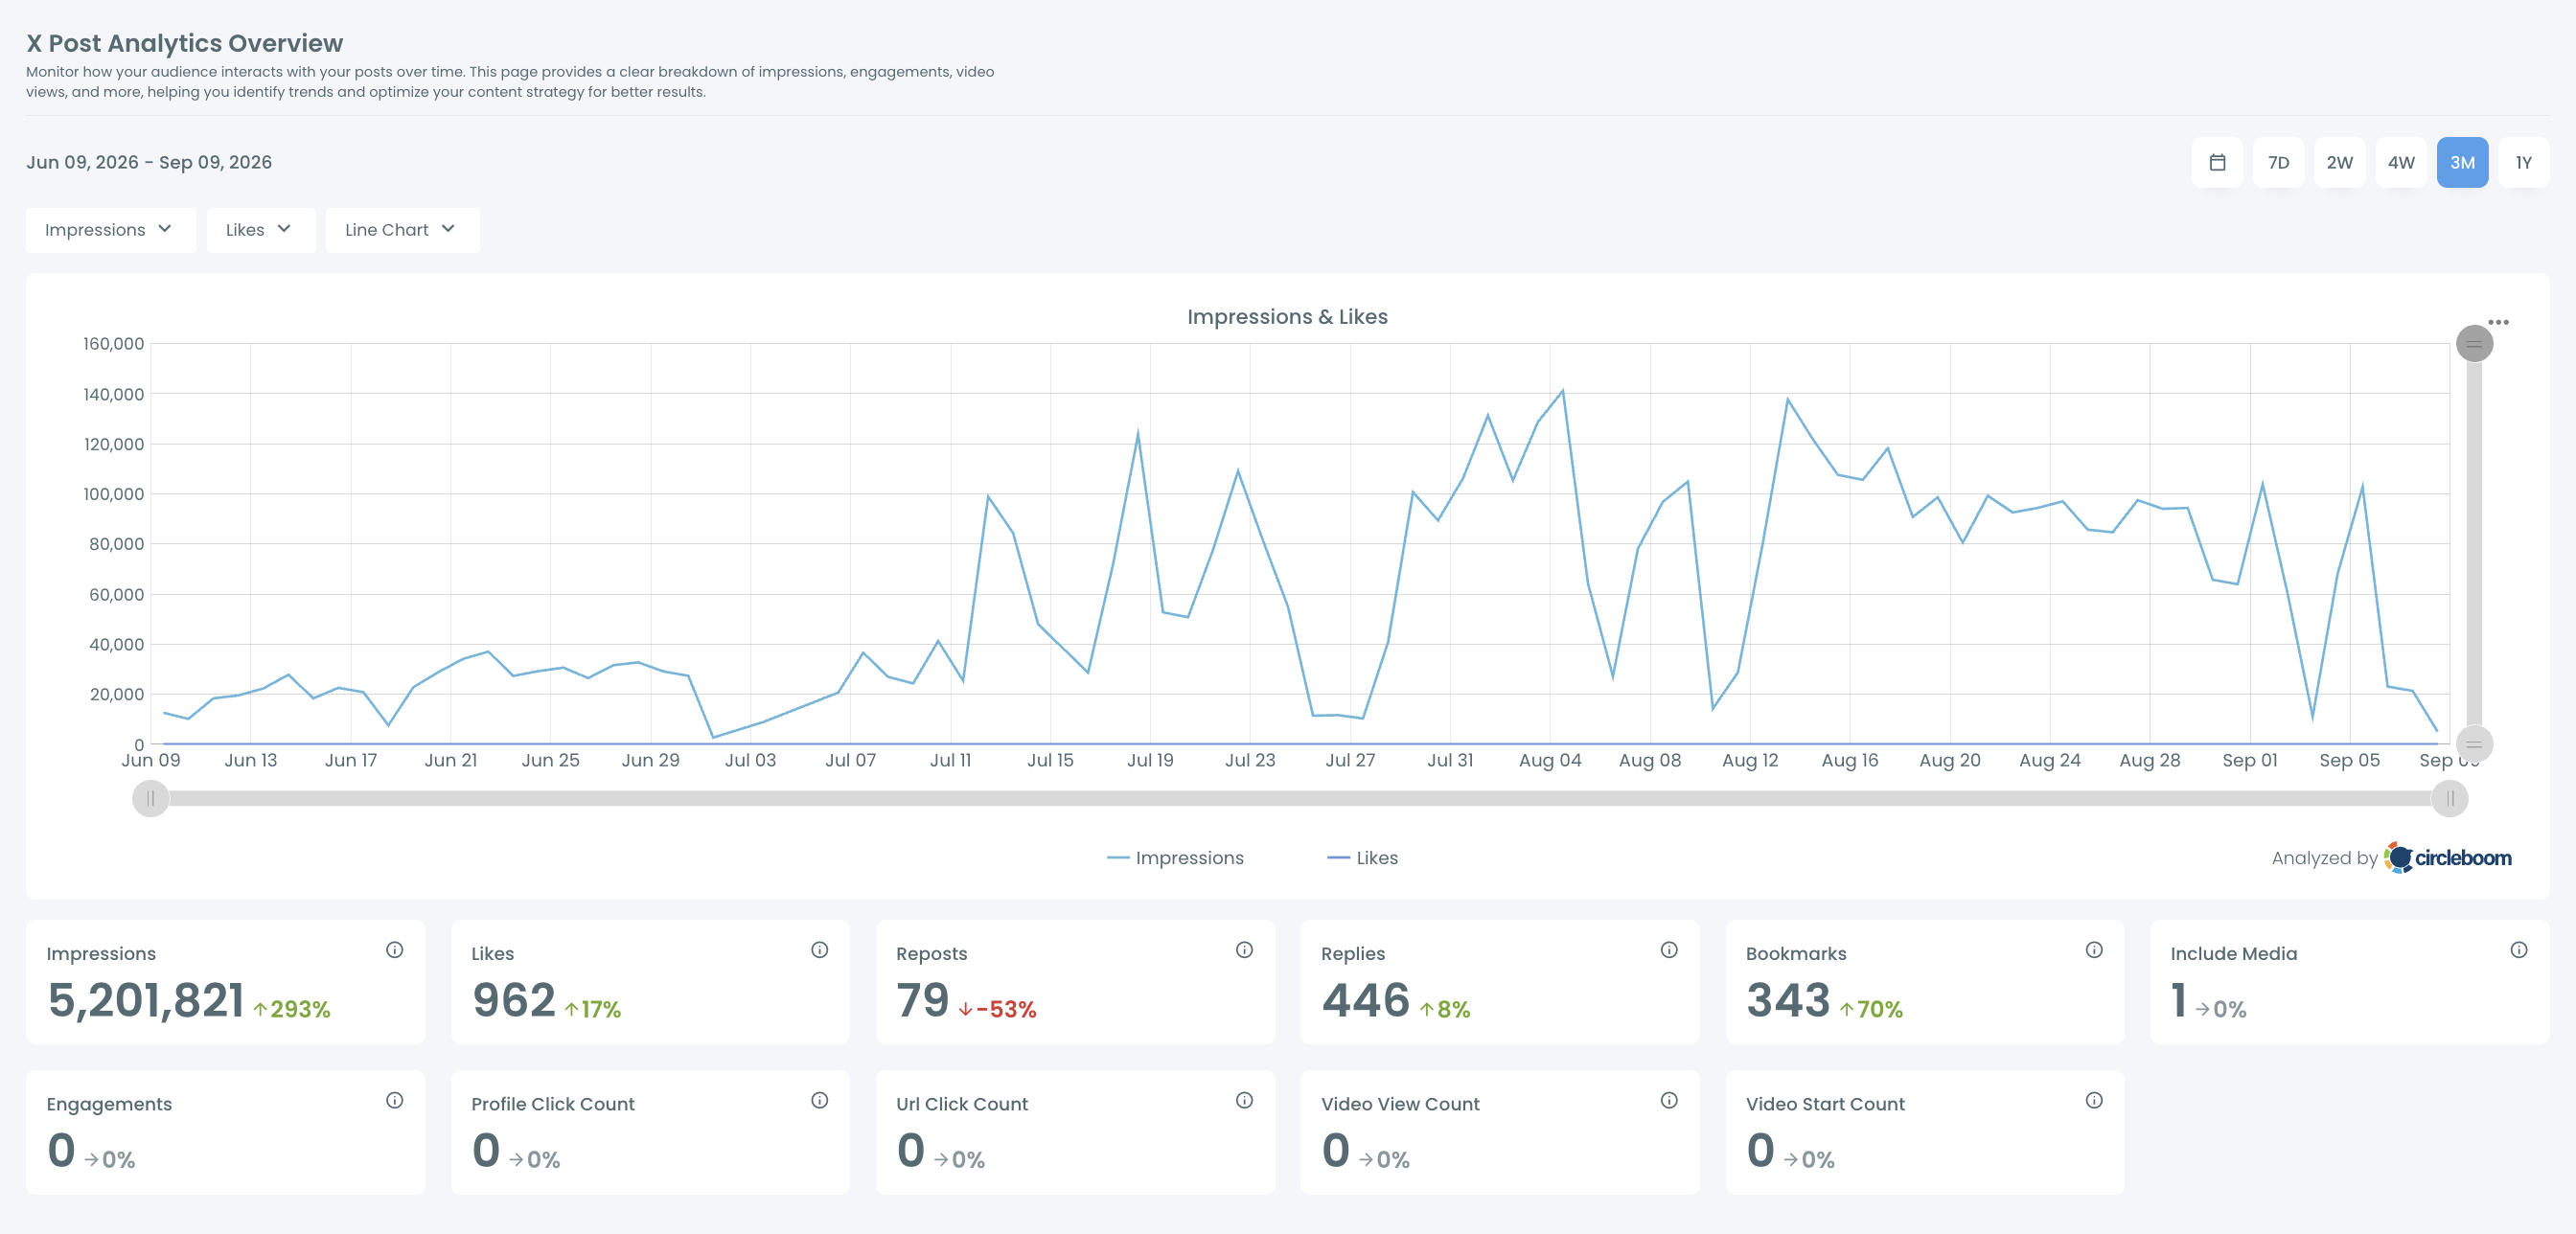
Look at absolute totals as well as percentages. A large percentage move on a small base can be a modest change in volume. For the wider set of numbers worth watching beside these two, the key Twitter performance metrics to track are a useful companion list.
Find the dates on the chart
Two Insights dropdowns above the chart let you plot any two metrics together as lines or bars. Put the fallen metric on the chart and find the dates where it dips. Those dates tell you which posts to open next in Post Engagement Analytics.
Keep three limits in mind while reading:
- The cards show post metrics and never show money.
- Impressions are totals, with no split for verified viewers.
- A 7-day range can swing sharply on a small sample, so 4 weeks or longer is steadier.
Check that the data is complete
A comparison is only as good as the data on both sides of it. Three things affect completeness: how long the account has been connected to Circleboom, how far back X returns analytics for older posts, and the access tier of the connected account.
If a metric looks empty or partial for the earlier period, treat it as a coverage gap to inspect. It is not proof that the audience did nothing. A red arrow measured against an incomplete baseline can mislead in either direction, so confirm both periods carry data before drawing a conclusion.
The overview cannot tell you what X paid for. It tells you which of your own numbers moved, and that is the part you can act on.
For impression-specific reading, Circleboom's Impression Analytics page covers that metric on its own.
Which cause fits your account
Match what you see to one row, then take that row's next step. The table assumes the range is set to the payout period, so every change is measured against the period before it.
| What you see | Card that shows it | Likely cause | Next step |
|---|---|---|---|
| No payout at all | None | Payment setup, status or eligibility | Check monetization and payment settings on X |
| Impressions down, Engagements down in step | Impressions | Fewer people saw your posts | Check visibility and posting volume |
| Impressions flat, Engagements down | Engagements | The audience responded less | Review the posts and the audience behind them |
| Totals down, average per post level | All totals, with the post count from Tweet Stats | You published less | Compare posting volume across the two periods |
| Previous period had one huge post | Impressions, on the chart | A standout inflated the baseline | Compare against a longer range |
| Nothing moved, payout still fell | None | A cause on X's side | Read X's programme and standards pages |
The last row is the one most write-ups skip. When every card is gray or green and the payment is still smaller, your content did not cause the drop. The explanation is in what X counts: which viewers, which surfaces, which posts. I would stop adjusting content at that point and read the policy pages instead.
The second and third rows are the ones worth separating with care. They look alike in a payout figure and need opposite responses. One is about being shown. The other is about being worth stopping for.
Did you simply post less in that period on Twitter?
Posting less is confirmed by counting posts in the payout period and in the period before it. If the count fell and the per-post numbers held, volume explains the drop and nothing about your content needs to change.
The overview hints at volume through the Include Media card, which counts posts that carried media, but it does not give a full post count. Circleboom's Tweet Stats is the view built for this. It covers posting volume, tweet count history, cadence and gaps.
Gaps deserve a second look. A week away from the account takes that week's posts out of the total, and the days around a break are often thin as well. If the chart shows a flat stretch that lines up with a break, the cause is found.
A higher or lower total says nothing by itself about the average post. Divide before you conclude. Fewer posts with the same average is a scheduling issue. The same number of posts with a lower average is a content or audience issue.
Do inactive followers or bots hold down X creator earnings?
Followers who never respond hold down the engagement side of your numbers, and that can drag a payout indirectly. They do not remove money directly. What they do is weaken the response each post gets.
The sign to look for is the third row of the table: impressions level, engagements falling. When that pattern lasts for several weeks, check two things. One is posting frequency. The other is audience quality, which Circleboom reports in its Followers' Characteristics view.
For the response-side rows of the table: a podcast episode on seven reasons Twitter engagement runs low and the fix for each.
Keep the conclusion narrow. A quiet audience explains a fall in response. It does not explain a fall in impressions on its own, and it says nothing about a programme change. Treat it as one candidate among the six, and confirm it with the cards before acting on it.
Any cleanup that follows is a separate decision. Circleboom frames removals as gradual, rate-limited actions that you confirm yourself, so nothing happens to an audience automatically.
A lower payout is a measurement problem before it is a content problem
A payout tells you how much, and only a period-over-period reading of your own post metrics tells you why.
→ Compare your X creator payout periods
Frequently asked about falling X payouts
Is X limiting my account if my impressions fell off suddenly?
Not necessarily. A sudden fall can come from a visibility limit, but it can also follow a change in plan or posting pattern. A drop in X interactions after going Premium is one example of the second kind. Run Circleboom's Shadowban Test to check visibility directly before assuming a restriction.
How do I get my X payout back up next cycle?
Fix the cause the cards pointed to, then plan the next period around it. In Circleboom, X Post Planner sets themes, timing and cadence, When Followers Are Online shows the hours your audience is active on Twitter, and Generate My Next Post drafts from your real performance. I would change one thing per cycle, so the next comparison shows what worked.
Do replies count toward X creator payouts?
X's current programme wording leaves impressions on replies out of the eligibility count. Time spent in reply threads can still build an audience, but treat it as separate from the posts that qualify, and read X's programme page for the exact terms.
Do I need X Premium to see these post analytics?
Not for the Circleboom view. Accounts without an X Premium subscription can still view and export their post analytics in Circleboom, so reading a period on X this way does not depend on a paid plan. Whether the account qualifies for payouts is a separate matter, set by X's programme terms.
How current are the numbers on the cards?
They reflect the moment the page loaded. Posts that gain engagement afterwards do not update on screen until you refresh, so reload the overview before recording a reading.