
A competitor's best tweet format is the one that earns its highest engagement rate, and that is often not the format it posts most. You only see the difference when both numbers sit side by side for every rival, measured the same way.
Text, image, video and poll shares tell you a rival's habit; the top-performing format tells you its result. Circleboom lines up both for up to five X accounts in one Twitter report, using records it pulls through X's Enterprise API access.
→ Compare tweet formats with competitors on X
Below: the four patterns that tell you which format to copy, and which accounts to ignore.
What "best tweet format" means when you compare competitors on X
On X, "best tweet format" has two readings, and most competitor research mixes them up. One is the format an account uses most. The other is the format that performs best for it.
The first is a production habit. The second is a result. A brand can publish 90 percent text because text is cheap to make, while its strongest engagement rate comes from the few images it posts.
The format a rival posts most is its habit. The format that tops its engagement rate is the lesson.
That is why you need to compare tweet formats with competitors on X with both numbers in view. Looking at a rival's timeline shows you the habit, roughly, and hides the result entirely.
Circleboom puts the two into one panel pair for every X account in the set. That way you can compare your tweet formats with up to four competitors instead of scrolling and guessing.
What a sample report shows about format habits
In a sample report run on public accounts, the section sets two panels next to each other for every brand. The share of each format sits on the left, and the format with the highest engagement rate sits on the right:
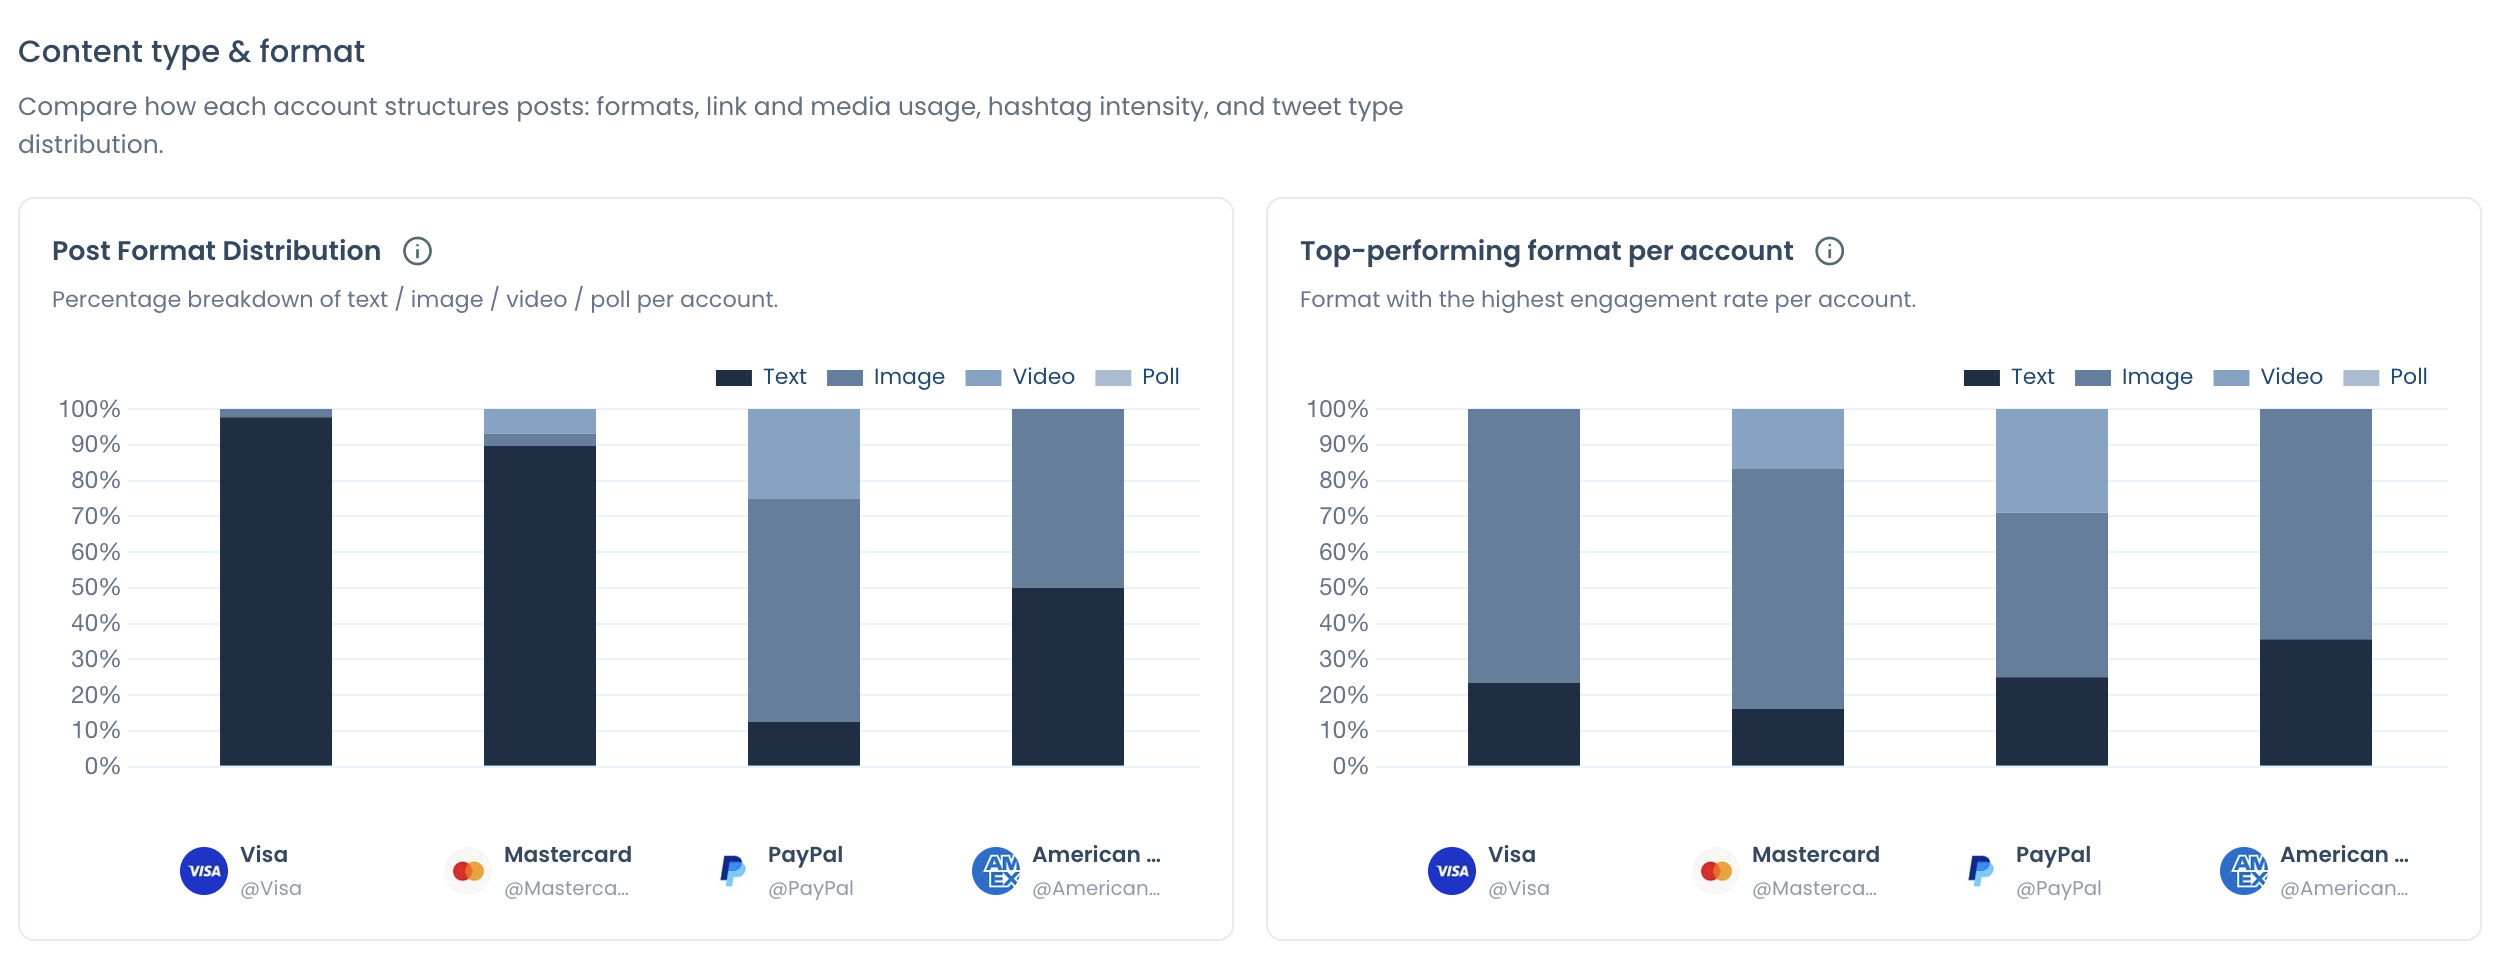
The right-hand panel is where the habit and the result can part ways. When a format that fills only a small slice of an account's posts still leads its top-performing panel, that gap is the finding worth acting on.
When images keep leading that right-hand panel across your set, the practical question becomes how to produce more of them without a designer. One route is covered in how a tweet can be converted to an image, which keeps the words you already wrote.
How Circleboom reads tweet formats across up to five X accounts
Circleboom's X Competitor Analysis & Benchmark Report compares up to five X accounts at once: your own account plus up to four competitors, or five other accounts if you leave yours out. For every account it retrieves followers, following and up to about 3,200 recent tweets, then calculates the same sections in the same order.
The records come straight from X. Circleboom holds Enterprise-level access to the X API, so no format count in the report rests on scraping, which can skip tweets or return incomplete fields.
The format answer lives in the report's Content Type & Format section. Five of its panels matter for this question:
- Post format mix: the text, image, video and poll share of each account.
- Top-performing format per account: the format with the highest engagement rate.
- Link & Media share: how many tweets carry an external link, and how many carry media.
- Original / Reply / RT / Quote distribution: what kind of tweet each account sends.
- Average post length: the typical character range each account writes in.
The same section also prints average hashtags per 500 tweets, which belongs to a different question than format.
If you want to see the panels before running anything, the Twitter competitor analysis sample report shows a full run on public accounts.
When you are ready to work on your own niche, run a format comparison against your X competitors and read it with the patterns below.
Four patterns that decide which tweet format to copy on X
Once you compare tweet formats with competitors on X, each rival falls into one of four patterns. The pattern, not the chart, tells you what to do next:
| Pattern | What you see | What it means | What to do |
|---|---|---|---|
| Habit and result agree | Most-used format also performs best | A tested routine | Test it if it suits your topic |
| Habit and result disagree | A minor format performs best | An under-used winner | Copy the winner, not the habit |
| Mostly replies | Original share near zero | Not a publisher on X | Drop it as a format benchmark |
| One standout post | Top format rests on few examples | A narrow signal | Check the leaderboard first |
The second row is where the useful findings sit, because it points at a format the rival itself under-uses.
Say polls top a competitor's engagement rate while making up a sliver of its posts. Before you add them to your own plan, read how to use Twitter polls to increase Twitter engagement.
The first row deserves more caution than it gets. A routine that agrees with its own result tells you the format works for that account and that audience.
It does not tell you the format will work for yours.
When production effort and results disagree
Production effort is not a result.
In the same sample report, the account with the heaviest media share in the set, 87.5 percent, also had the lowest engagement rate, 0.39 percent. A rival spending heavily on images and video is showing you its budget, not proof that the budget pays.
When text wins instead, the craft moves into the words themselves. The guide on how to format text in X posts covers the line breaks and styling of a text post.
Where link posts fit in a tweet format comparison
Link posts do not appear in the format mix as their own format. They show up in the Link & Media share panel, which prints one bar for tweets with an external link and one for tweets with media, and the two can overlap.
Read that panel next to the bottom of the leaderboards. If a rival's weakest tweets are mostly plain link posts while its media posts fill the top five, the rival is showing you which packaging its audience skips.
The same check works on your own account. A timeline made mostly of links with low engagement is a candidate for more native posts that make the point without sending readers away.
Five tweet formats that spread, and how to find live examples of each one in your niche before you write.
Is a reply-heavy competitor a format benchmark on X?
No. A competitor that sends mostly replies is running a support desk or a conversation channel on X, and its format numbers describe that job rather than a content strategy.
The Original / Reply / RT / Quote distribution is the panel that catches this. In the sample report on public accounts, one account ran at roughly 2 percent original posts, with customer-service replies filling most of its top five tweets.
Judged on engagement alone, that account looks like a weak publisher. Read with the reply split, it is not a publisher at all.
Copying its format mix would mean copying the shape of a help desk. Its replies are mostly text by nature, so its text share tells you nothing about what your original posts should look like.
There are two practical moves when one of your rivals turns out to be reply-heavy:
- Keep it in the report if you also care about audience quality or reach, since those sections still compare fairly.
- Leave it out of the format decision and weigh only the accounts whose original share is high enough to describe a publishing habit.
The reverse finding is useful too. If a rival's activity is 40 percent replies and its account is growing, replying is part of how it grows, and that is a behavior you can study separately from format.
Does post length count as a tweet format on X?
Yes, length works like a format on X, because a one-line post and a 600-character post are read differently and earn different responses. The report treats it as its own panel inside Content Type & Format.
The Average post length panel does not print a single average. Each bar carries a range label in the form "Typically posts between 16 and 610 characters." That range is the account's working length, not a measure of writing quality.
The detail most comparisons miss is where the range ends. X's developer documentation sets the standard post at up to 280 characters, so a rival whose range runs well past 280 is publishing long-form posts.
According to X's Premium help page, only Premium subscribers can create posts up to 25,000 characters, while everyone can read them.
If your competitors write long and your account cannot, matching their length is not an option you have yet.
Before you copy a length range, check what your own account allows. The breakdown of how many characters you can use on Twitter X is the place to confirm your ceiling.
A wide range also means mixing. An account that runs from 7 to 800 characters is not writing long posts; it is writing both short and long ones, and the leaderboard tells you which of the two the audience rewards.
How to compare tweet formats with competitors on X
To compare tweet formats with competitors on X, run one benchmark report on up to five public accounts, then read the post format mix against the top-performing format for each account. The leaderboard posts confirm whether a winning format rests on many tweets or one. The workflow below takes six steps in two phases.
Start the benchmark from the Monitoring menu
- Log in to Circleboom and connect your X account through the official OAuth screen.

- Open the Monitoring menu and select X Competitor Analysis & Benchmark Report, the first item in the list.

- Enter up to five handles under Account Handles, using the + button to add slots, then select Start Competitor Analysis.
- Choose Just this once for a single read, or Keep it up to date every month if you want the format mix tracked on a schedule.
Read the format panels in the right order
- Open Content Type & Format and read Post format mix next to Top-performing format per account for each rival.
- Check Content Leaderboards for the actual top posts, so you know whether a winning format rests on many tweets or a single one.
The order matters because the format panels only describe shares and rates. The leaderboard shows the posts behind them, and a format that wins on one viral tweet is a narrower lesson than a format that wins across dozens.
In short: log in, open Monitoring, add the handles, start the report, then read the format mix, the top format and the leaderboard posts, in that order.
What a format comparison on X can and cannot tell you
A format comparison describes a recent sample of each account's tweets, not its full history. Circleboom retrieves up to about 3,200 recent tweets per account, so the same sample covers a shorter period for a rival that posts ten times a day than for one that posts twice a week.
That matters when one account just changed direction. A rival that switched to video a month ago shows a small video share if its sample still holds months of older text posts.
Limits apply to which accounts you can compare. Only public accounts can be analyzed, and an account above 3,000,000 followers cannot be added, whether it is a competitor or your own.
The page on how many accounts you can compare in a competitor analysis report lists the rules in one place.
The report also has no thread usage rate. A thread counts by the format of its tweets, so threads appear only when you read a rival's top posts in the leaderboards.
If those posts turn out to be threads, the walkthrough on how to make a thread on Twitter gets you from finding to first draft.
A format share is a reading of recent behavior, not a permanent trait. Re-read it after a few weeks before you commit a quarter of production to it.
Comparing tweet formats with competitors on X: the short version
The best format for a competitor is the one that tops its engagement rate, not the one it posts most. Read the two side by side, drop reply-heavy accounts from the decision, check the leaderboard before trusting a winner, and treat length as a format with a ceiling set by your own account.
Done that way, a format comparison tells you where to put production effort next week, with figures you can source when someone asks where they came from.
→ Start comparing tweet formats with your X competitors
Format comparison on X: questions before your first run
How do I check whether a new format works on my own account?
Run the new format for a few weeks, then open your own posts in Twitter engagement analytics and compare them with your usual posts. Circleboom's Post Engagement Analytics shows each of your X posts with its interactions, so the test is measured on your account rather than your rival's.
Can I count my competitors' tweet formats by hand instead?
You can for one account and one week, but the counts will not hold up next to each other. A profile shows no format mix, no top-performing format and no per-post averages, so hand-counting several rivals over different periods produces numbers that were each gathered differently.
Does the Followers / Following toggle change the format numbers?
No. The toggle switches only the audience panels between followers and following. Content Type & Format describes each account's own tweets, so it reads the same in both views.