

X only shows your current follower count, so it can't tell you when you gained the most followers. To find your biggest growth days, open Circleboom's Followers' Growth feature and switch to the Daily Change tab. Every bar is one day of gained or lost followers, so the tallest bar above zero is your best day. Zoom in on that date with the timeline selector, then check what you posted that day.
Your follower count tells you where you are. It says nothing about how you got there.
Maybe the account crossed 5,000 last month and you are not sure why. Maybe it jumped by a few hundred in one week and then went quiet again. You remember a thread doing well at some point, or a bigger account quoting you, but you can't put a date on any of it.
So you open your profile, and X shows one number. Today's number. No history, no chart, no way to scroll back and see which week the growth actually happened. The analytics most people check focus on posts, not on how the audience behind them changed day by day.
That is the frustrating part. The day you gained the most followers is the day worth studying, because whatever happened then is the thing to repeat. Circleboom's Followers' Growth feature records your follower count every day through X's official API and shows exactly which days brought in followers and which ones lost them.
Why Circleboom can answer this and your profile can't
Circleboom is an Official X Enterprise Developer and works directly with X's official APIs. Once your account is connected, it records your follower count at regular intervals and stores each value with a timestamp. Comparing each day with the day before gives the net change. No scraping, no guessing, no password sharing.
That gives you a timeline instead of a single number. Inside the Followers' Growth page, you get:
- A Daily Change chart. Bars above zero are days you gained followers, bars below zero are days you lost them.
- A Performance chart. A line showing your total follower count over time, so you can see slow climbs, plateaus, and sudden steps.
- A timeline selector. Drag it to zoom in on a single week or out to the full history.
- Chart export. Save the current view as PNG, JPG, or PDF for a report.
Tracking starts on the day you connect your account and keeps building from there, so the earlier you connect, the further back your growth story goes.
When did I gain the most followers? How to check with Circleboom
Step 1: Open Followers' Growth. Log in to Circleboom Twitter, connect your X account, and open Followers' Growth under your follower stats.
Step 2: Switch to Daily Change. The Daily Change tab shows "Daily Change in Followers" as a bar chart. Look for the tallest bar above zero. That is the day you gained the most followers in the visible range.
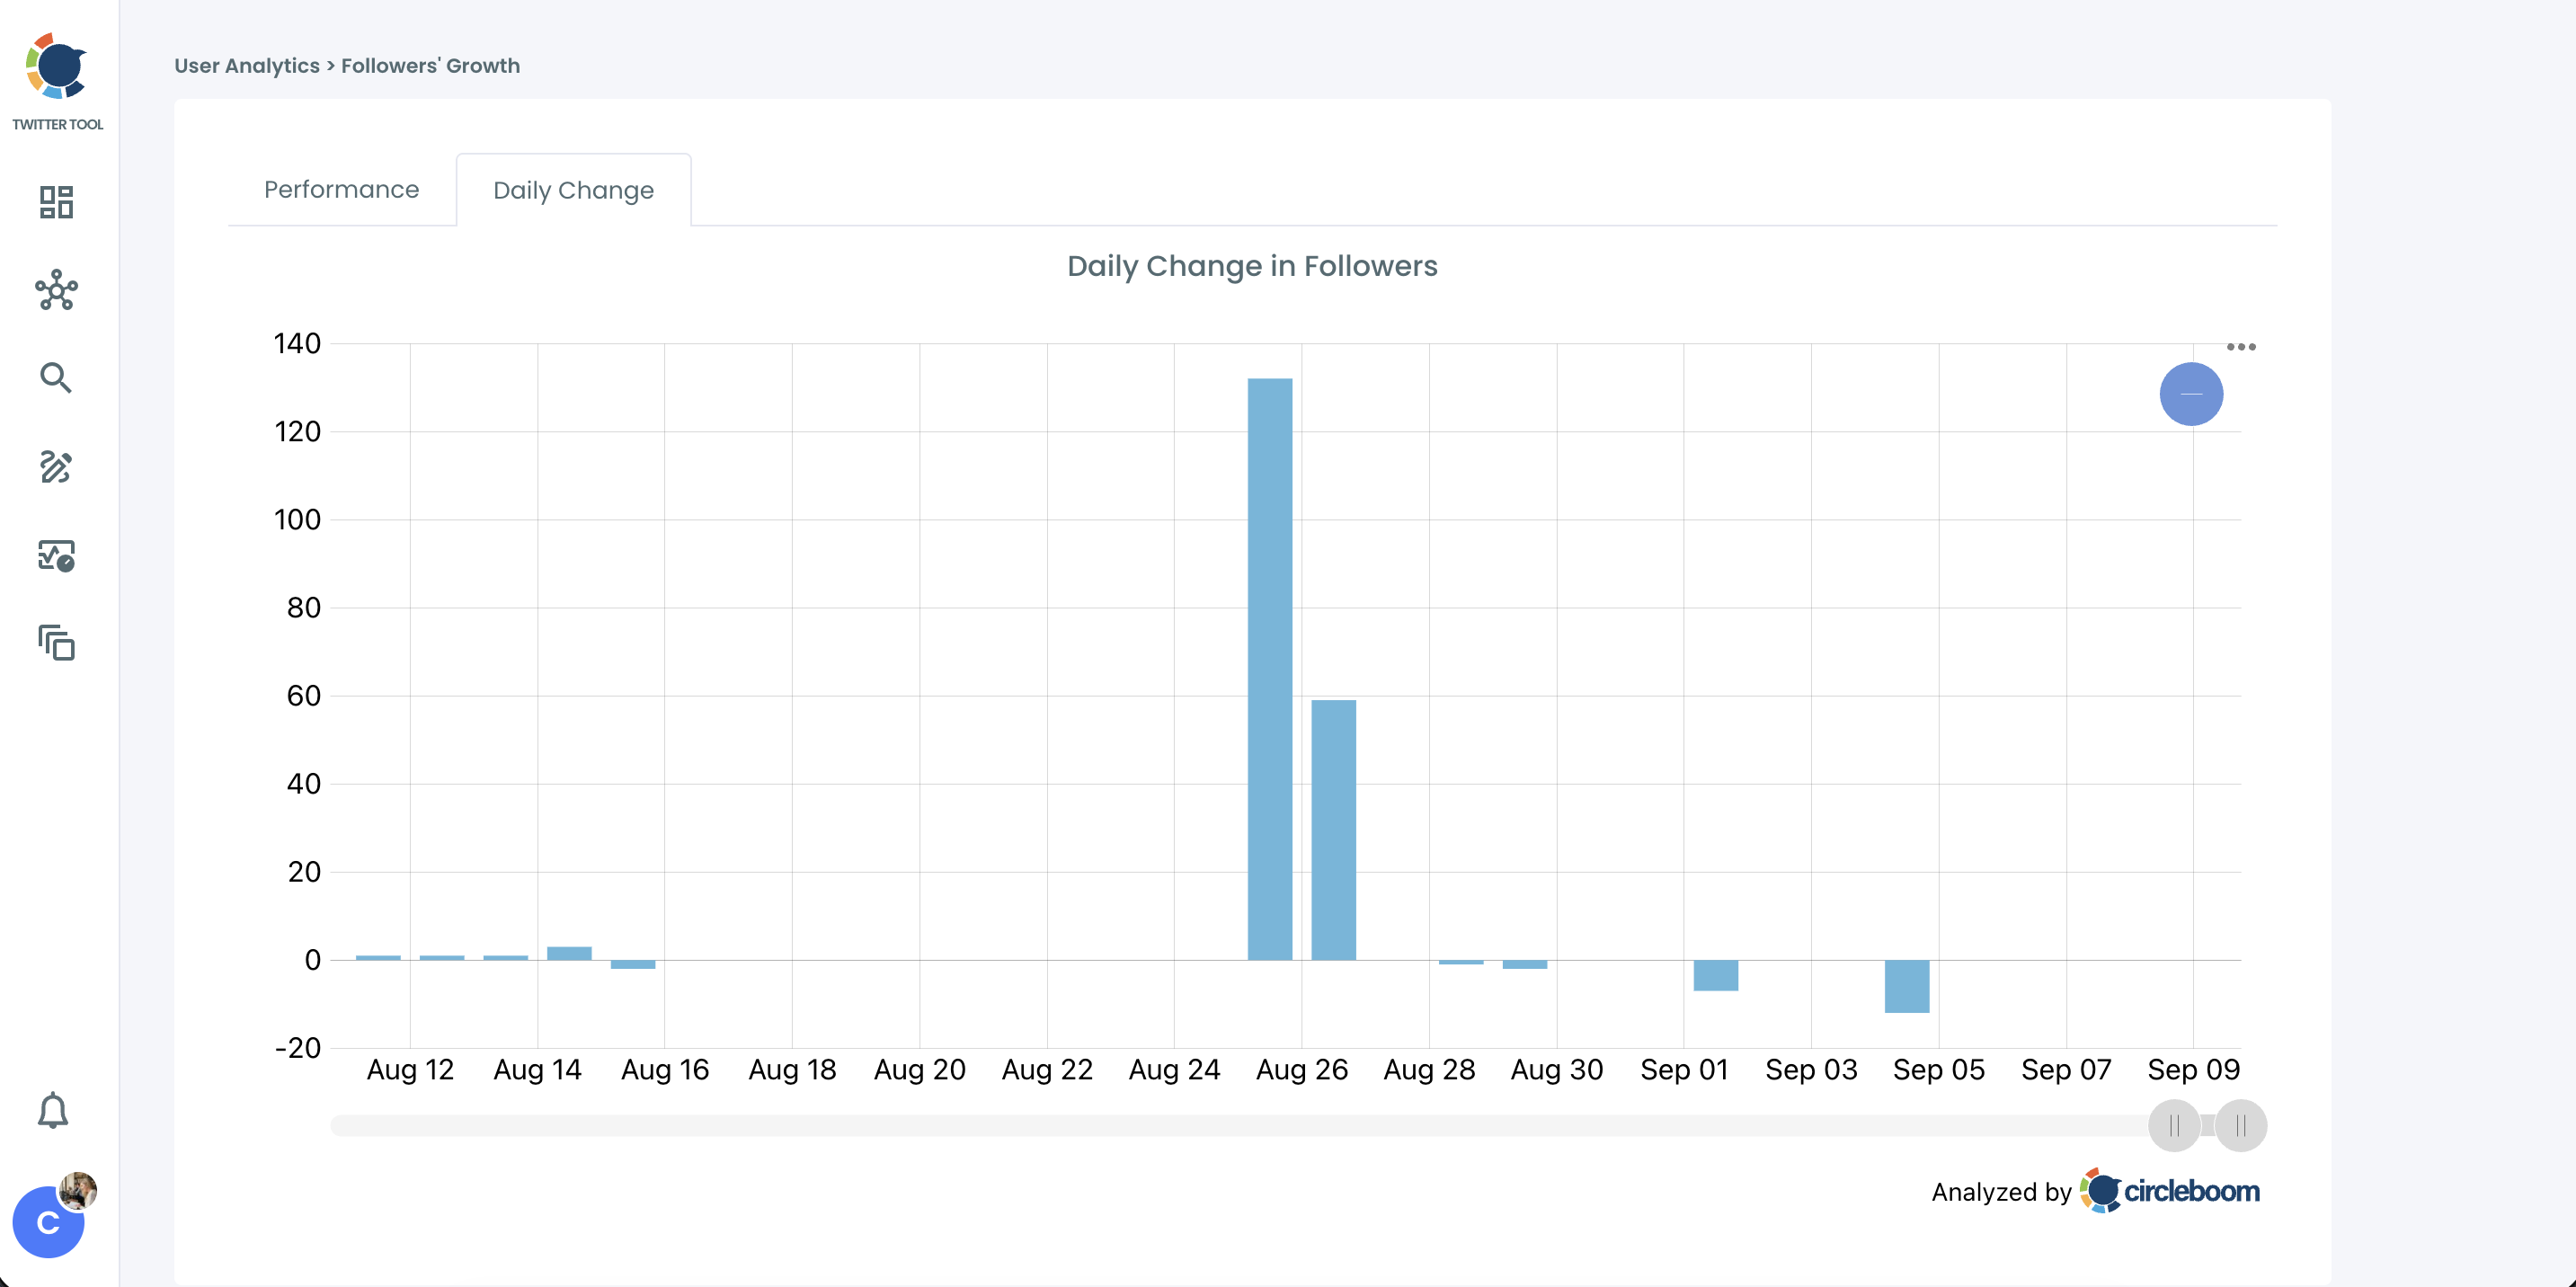
Step 3: Zoom in on the spike. Use the timeline selector below the chart to narrow the window around that bar. A short window makes it clear whether it was one big day or a few strong days in a row.
Step 4: Check the Performance tab for the bigger picture. Switch to Performance to see whether the spike changed your overall trend or whether the line went back to its old pace afterwards.
Step 5: Match the date to your posts. Open Post Engagement Analytics and look at what you published on and just before that date. The post with unusually high impressions or engagement is usually the one that brought people in.

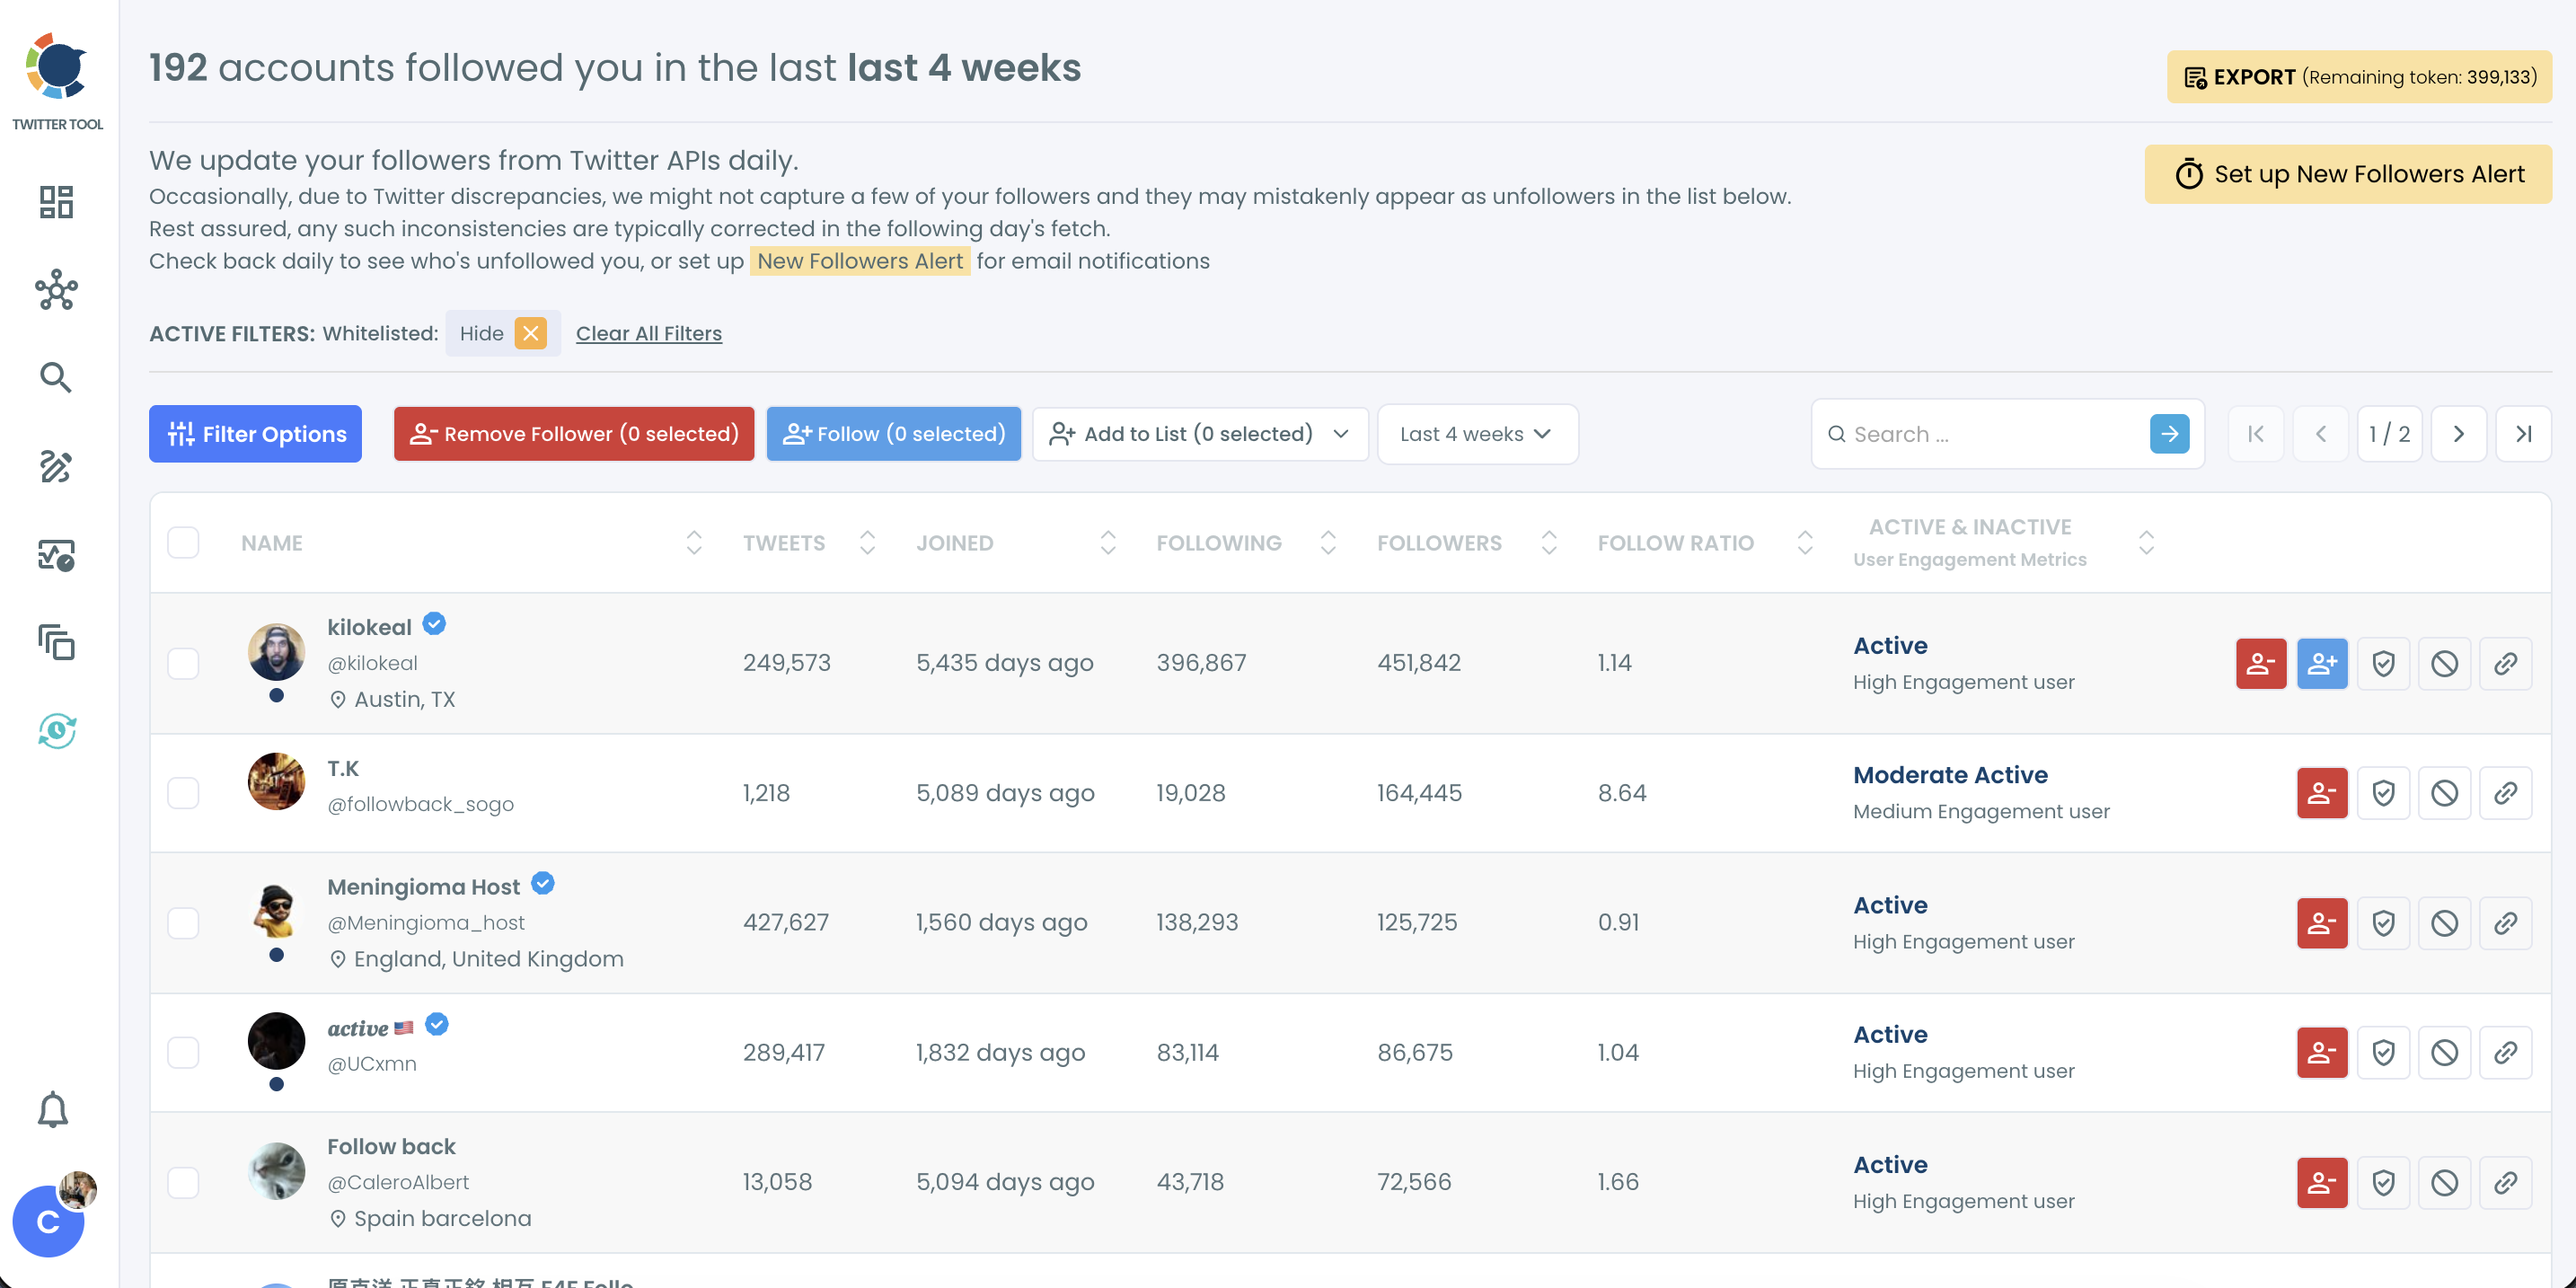
Step 6: See who actually followed you. Open Who Followed Me and pick the period around your spike. The list shows the accounts that followed you, so you can tell whether the growth came from real people in your niche or from something less useful.
When did I gain the most followers, and why?
Once you have the date, the next question is why. Most spikes come from a short list of causes.
A post that traveled. A thread, a strong opinion, or a useful tip that got shared well beyond your usual audience. This is the most common reason and the easiest to learn from.
A mention from a bigger account. A quote, a reply, or a shoutout from someone with a larger audience can send a wave of new followers in a single afternoon, even if your own post was ordinary.
A giveaway or campaign. Follow-to-enter contests and promotions bring quick numbers. Some of those followers stay, many leave once the giveaway ends.
News or a trend in your niche. If your topic suddenly matters to more people, accounts that already cover it pick up followers.
A suspicious wave. Hundreds of followers in a day or two with no clear trigger can mean bot accounts. A spike followed by a slow drop over the following weeks is a typical sign.
📌 Read the Daily Change chart together with the Performance chart. A tall bar followed by several negative bars means many of those new followers did not stick around.
Why your best follower day matters more than your follower count
It shows what to repeat. If your biggest growth day came from a how-to thread, more how-to threads are a better bet than guessing. Matching the spike date to the post that caused it is the most direct way to repeat the growth. The same idea is covered in how to gain more followers on Twitter organically.
It separates real growth from noise. A spike that holds is a sign of real interest. A spike that disappears within weeks points to a giveaway crowd or a bot wave. If it looks suspicious, Circleboom's Fake/Bot Followers feature shows which accounts show bot-like patterns so you can review and remove them.
It explains drops too. Net growth hides churn. A month that looks flat might have brought in hundreds of followers while just as many left. Who Unfollowed Me shows who left, and how to see who unfollowed you on Twitter explains how to read those losses.
It sets a baseline for campaigns. If you normally gain about 10 followers a day and gain 45 a day during a campaign week, the campaign added roughly 35 a day. Without the daily history, there is nothing to compare against.
It helps you post at the right time. Spikes often line up with posts that went out when your audience was online. Circleboom's When Followers Are Online feature shows those hours, and Tweet Stats shows whether a change in your posting volume lines up with a change in growth.
FAQ
How can I see when I gained the most followers on Twitter?
X doesn't show follower history on your profile. With Circleboom's Followers' Growth feature, open the Daily Change tab and look for the tallest bar above zero. That bar is the day you gained the most followers in the selected time range.
Can I see my follower count history on X?
Not on your profile, which only shows the current number. Circleboom records your follower count every day after you connect your account and shows the history as a line chart in the Performance tab.
How far back does Circleboom's follower growth data go?
The history starts on the day you connect your X account to Circleboom and grows every day after that. Connecting early gives you the longest record to work with.
Why did I suddenly gain a lot of followers on Twitter?
Common reasons are a post that spread widely, a mention from a bigger account, a giveaway, or a trend in your niche. A sudden wave with no clear trigger can also be bot accounts. Read more in why am I all of a sudden getting new followers.
Can I see which accounts followed me on my best day?
Yes. Open Who Followed Me in Circleboom and select the period around your spike. You can review the accounts, follow them back, add them to a list, or remove the ones you don't want.
Can I export my follower growth chart?
Yes. Each chart has a three-dot menu with PNG, JPG, PDF, and Print options. The export captures the current tab and time window, so set the date range first.
Is Circleboom's follower growth data accurate?
Circleboom is an Official X Enterprise Developer and collects follower counts through X's official API. The daily change is calculated from those recorded counts.
Final thoughts
A follower count is a finish line with no map. Answering "when did I gain the most followers?" turns that number into something useful: a date, a post, a reason, and a pattern you can build on. Circleboom's Followers' Growth chart shows the day, the post analytics show what caused it, and Who Followed Me shows who arrived. After that, growing again is less about luck and more about doing the thing that already worked.
Find your biggest growth days with Circleboom:

