

What can you see about an X account you do not own? More than its profile page shows and less than its owner sees, and the line between the two is drawn by what X treats as public.
X alone: a follower count, a following count and recent posts. Circleboom: Circleboom reports nine comparable sections of analytics for any public account on X, using records retrieved through official X Enterprise APIs.
→ Twitter profile analytics
Three numbers stay with the owner for every account, and the table below names them.
Why another account's X analytics page stays closed
X shows an account's analytics dashboard to that account's owner and to nobody else. No setting, link or plan makes one account's dashboard readable from another login.
The split is written into X's own developer documentation. The X API data dictionary separates a post's public metrics from its non-public metrics, and it states that the non-public group requires user context authentication. In plain terms, the account itself has to authorize the request.
The public group is wider than most people assume. It holds these counts for each post:
- Likes and reposts.
- Replies and quotes.
- Bookmarks.
- Impressions.
The useful question is how much can be built from those public fields.
What an X profile page shows and what it leaves out
A profile page answers that badly. It exposes two totals and a scroll of recent posts, and it leaves out the parts an analyst needs:
- The bot share and the inactive share of the audience.
- The format mix and the cadence history.
- Audience geography and language.
- Per-post averages for any interaction.
It also offers no way to line one account up against another, which is the only way a number can be judged.
That gap also explains the market for tools that promise to reveal who looked at a profile. The claim behind a Twitter profile viewer for who visited your profile is a separate subject, and it has nothing to do with the public fields this article maps.
Twitter profile analytics for an account you do not own are assembled from those public fields, for every account the same way. With Circleboom, you can read analytics for a Twitter profile you do not own next to up to four other accounts in a single dated report.

Which Twitter profile analytics are visible, owner-only or missing?
Every metric about another X account falls into one of three groups: visible for any public account, visible to the owner alone, or absent from the report altogether. The table sorts Circleboom's X Competitor Analysis & Benchmark Report by that rule.
| Area | Visible for any public account | Visible to nobody but the owner | Not in the report |
|---|---|---|---|
| Account basics | Followers, following, active followers share, account age | Profile visits | Follower-to-following ratio |
| Audience | Quality classifications, verified badges, country, time zone, language, gender, bio keywords, active times | None | Followers shared between two accounts |
| Posting and content | Cadence, consistency, posting hours, post length range, format mix, link and media share, hashtags per 500 tweets, original, reply, repost and quote split | None | Thread usage rate, @-mentions |
| Engagement and reach | Average likes, reposts, replies, quotes and bookmarks, engagement rate, impressions | URL clicks | A follower-based engagement rate |
| Video | Video posting rate, total video views | Video retention curve | None |
| Top posts | Top 5 by engagement, impressions, replies and bookmarks, a head-to-head, under-performers | None | Influencer and Newbie drill-downs |
Two table facts that change how X numbers are quoted
Two facts in that table are the ones most write-ups miss.
The first is about the middle column. Those owner-only metrics are left out for every account in the comparison, your own included, so the report never shows a filled cell next to a blank one.
The second is about the rate: engagement rate here is total engagement divided by total impressions, not engagement divided by followers.
That basis changes how the figure should be quoted. It describes how often people who were shown a post interacted with it. It says nothing about interaction relative to audience size, so quoting it beside a follower count invites a wrong reading.
What the visible columns add up to for a public X account
The visible column is organized as nine report sections, and each one renders the same charts for every account in the set:
- The essentials at a glance.
- Audience quality, plus audience demographics and geography.
- Posting behavior, plus content type and format.
- Engagement and reach, labeled Impression/Views in the report.
- Content leaderboards and video performance.
The audience sections have a second view. A Followers and Following toggle switches those panels from the people who follow an account to the accounts it follows. Post-based sections do not change with the toggle, because they describe the account's own posts.
The audience rows are more than percentages. Drill-down lists name the accounts behind a classification, and those rows print the share and the raw count together.
The first row and the impressions chart for an outside Twitter account
The report opens with an essentials table, one row per account. Its ACTIVE FOLLOWERS column is a percentage, and its AVERAGE IMPRESSIONS column is an average across the analyzed posts, not a period total.
I read that row as a map and not as an answer. It shows which account deserves a closer look, and the later sections explain why.
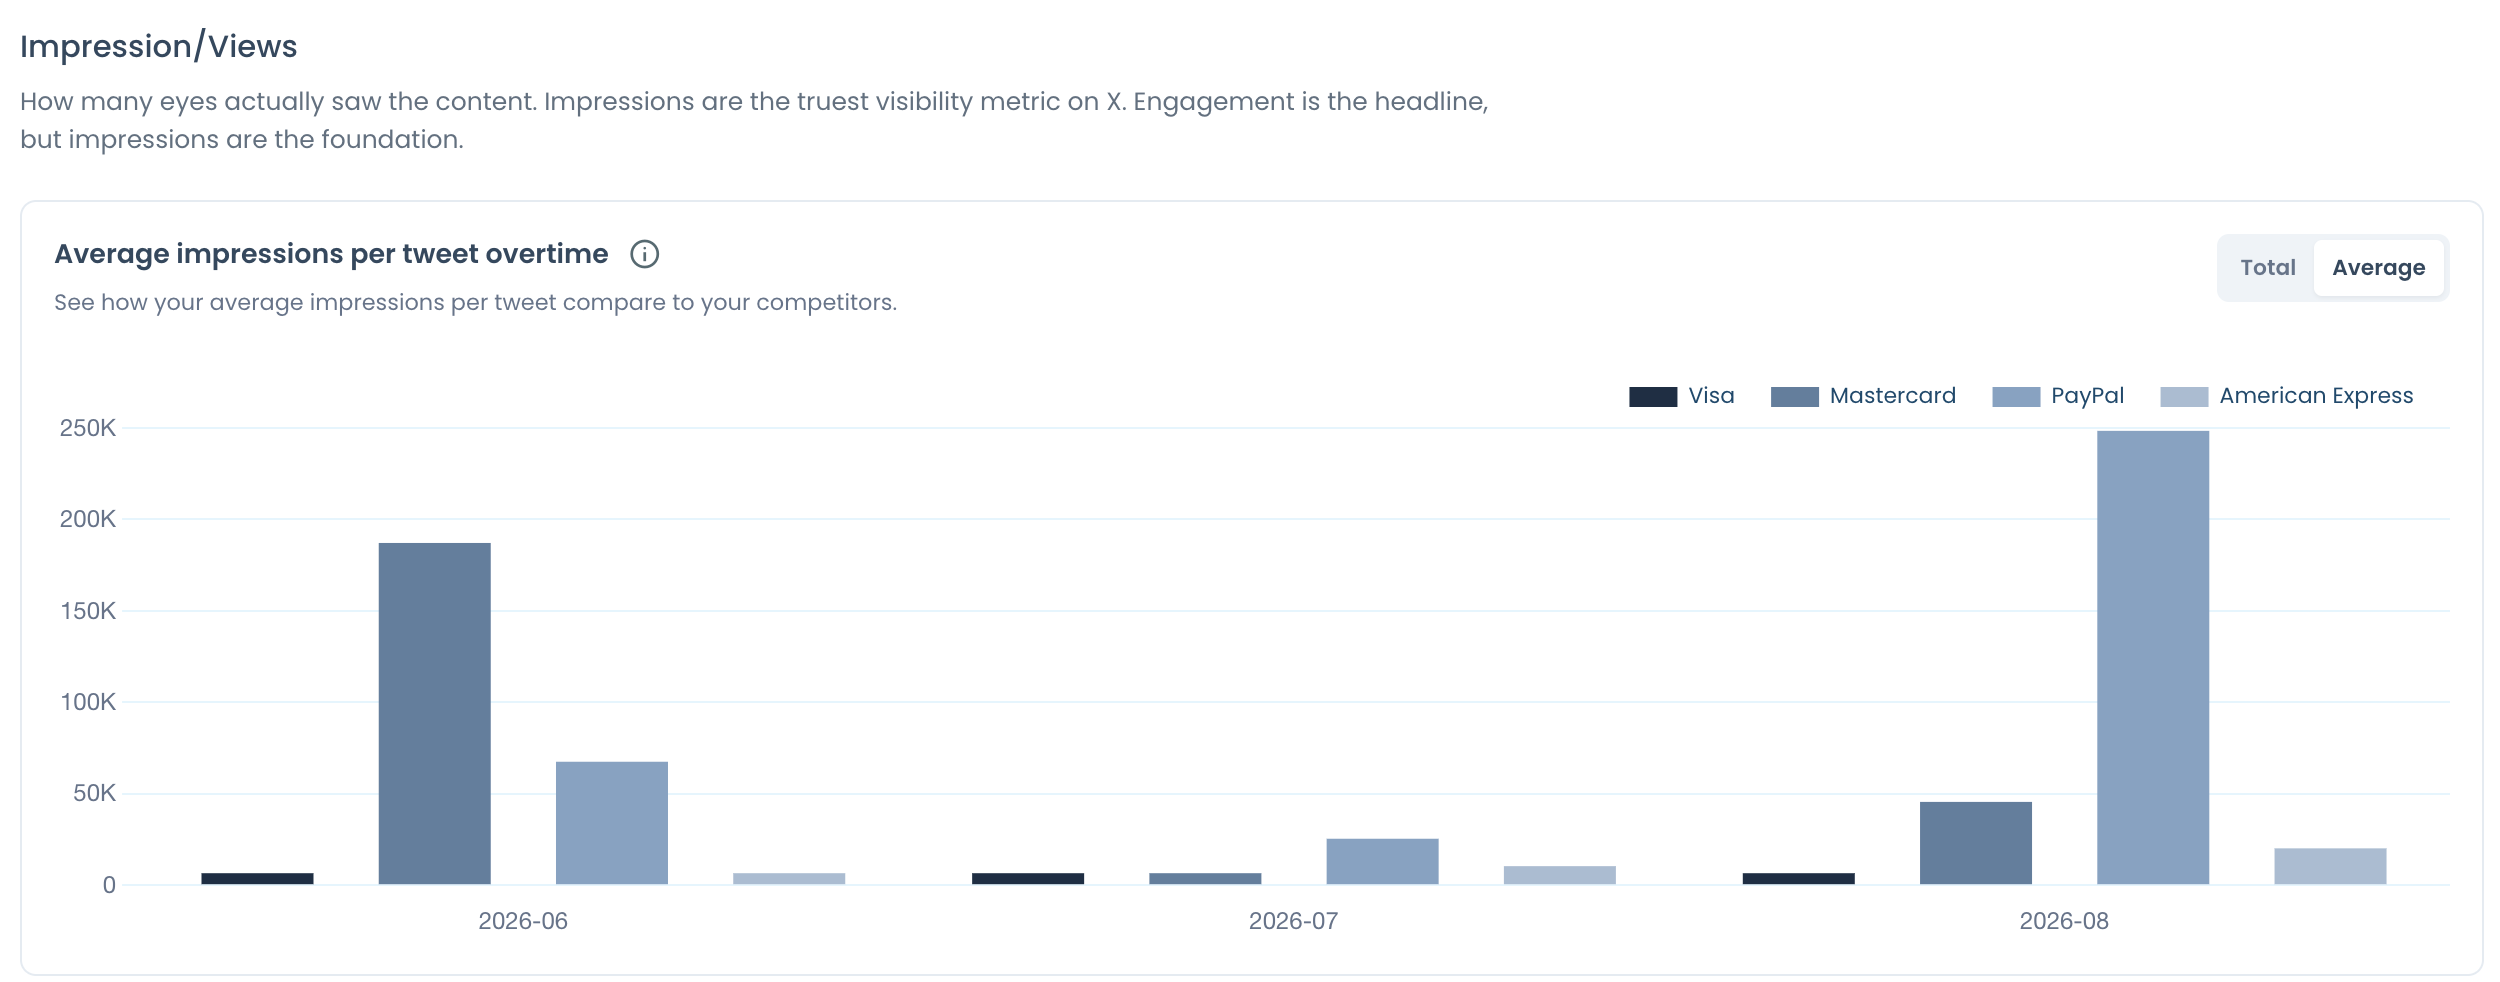
Impressions are the piece people least expect to find for an outside account. The Impression/Views section charts them month by month, as a total and as an average per tweet, for each compared handle.
One reading note applies to every classification in the audience rows. Circleboom calculates labels like suspected bot and inactive from the retrieved records to flag profiles for review. They show where a closer look is warranted and settle nothing about an individual account.
Not every question needs the full table. For a single post or a fast rate check, the free Twitter tweet engagement calculator is the lighter stop.
Follower-list tour on video: searching and analyzing the followers of an account that belongs to someone else.
Which X accounts can be analyzed and which are refused?
Only public accounts with 3,000,000 followers or fewer can be analyzed, because X profile analytics for outsiders exist only where the records are public. Which of the three situations below applies to your target decides whether a report can run at all.
The account is protected. It cannot be added. X's page on public and protected posts explains that a protected account's posts are visible to its approved followers only, so there are no public records to read.
The account has more than 3,000,000 followers. It cannot be added either. The cap applies to every column in the comparison, including your own account if it is that large.
The account is public and under the cap. It qualifies for any of the five slots, whether or not you have any connection to it.
The detail that catches people is the scope of the cap. An oversized handle cannot be added to a comparison at all, so the report never carries a partial column for it. The set has to be built from accounts that qualify.
I check eligibility before I choose a peer set, not after. A comparison planned around a category leader that turns out to be over the cap has to be rebuilt around accounts closer in scale, and those are usually the more useful peers anyway.
Can you see another Twitter account's profile visits or link clicks?
No. Profile visits and URL clicks are not available in any column of the report, for any account, by design. The video retention curve is excluded with them.
The reason is structural. Those numbers exist only inside the owner's own analytics, so no outside party holds them for a second account. A comparison needs the same field for every column, and a field that exists for one account at most cannot be compared.
That is also why the report leaves them out of your own column. The comparison keeps only the fields that every account in the set can fill.
The same boundary answers the older question of whether such a count exists publicly at all, which is the subject of does Twitter have profile views.
For those three metrics on your own account, use the owner-side analytics. For a full read of your own profile with no other account involved, Twitter Account Analysis is the route.
An owner-only metric cannot be benchmarked, because no peer's value exists to compare it with.
That is the practical point inside a technical limit. The numbers you cannot see for others are the numbers that would not have told you where you stand.
How Circleboom builds profile analytics for X accounts you do not own
The report starts from handles, not logins. After you open Circleboom Twitter Management, the X Competitor Benchmark Report sits first in the Monitoring menu, and its Account Handles panel takes up to five accounts in total.
You can put your own account in the first slot and add up to four others. You can also leave yours out and enter five outside accounts.
Pressing Start Competitor Analysis begins the run. A choice comes with it: Just this once, or Keep it up to date every month.
One retrieval, the same sections for every account
Circleboom builds its Twitter profile analytics from one retrieval: the followers, the following list and the recent tweets of every account in the set, pulled in one run. There is no per-account or per-section refresh.
From those records it calculates the metrics, the classifications and the demographic breakdowns. Each run is dated and saved under Your saved analysis, so a figure quoted later carries its run date.
That consistency is what a hand-built comparison lacks. With Circleboom, you get X profile analytics across public accounts where every column was gathered the same way.
Why the source matters more when the account is not yours
A number about someone else's account gets questioned harder than a number about your own. Circleboom is listed on X's Enterprise customer directory, so the records come through X's official API and you can state the source when a client or a manager asks.
Scraping-based collection is the alternative, and it can miss records or return incomplete fields. An analysis of an account you cannot verify from the inside needs the opposite: complete public records and a documented path.
Watching an X account after the first report
A report is a dated snapshot of Twitter profile analytics, not a live feed. The monthly option repeats the same set automatically.
Follower movement is a different job. To follow a headline number over time, a Twitter follower count tracker is the closer fit.
New follows and new followers on a specific account are covered by tracking someone's followers and followings on X.
What the visible X numbers are good for
The public set is enough to answer the questions people ask about outside accounts. Brand and social media managers use it to separate a visibility gap from an interaction gap. Partnership teams use it to check a creator's audience before a fee is agreed.
Both jobs depend on the same property. Every account in the set is measured on one basis, on one date, from one source.
I have watched a follower count win an argument it should have lost, only because nobody in the room had a second column to put beside it. That is the practical case for Twitter profile analytics on accounts you do not run.
Read in that light, profile analytics for other X accounts are less about access and more about comparability. Once two accounts share the same columns, each figure has something to be measured against.
Summary of what you can see on other X accounts
For any public X account under the follower cap, Twitter profile analytics cover the audience behind the count and the performance of the posts. They never include the owner-only trio in the table's middle column, for you or for anyone else outside the account.
Circleboom puts the visible set into one sourced, dated report for up to five accounts, with the engagement rate stated against impressions. That is what makes the numbers usable outside the team that pulled them.
→ Open Twitter profile analytics for other accounts
What to know about analytics for X accounts that are not yours
Do I need X Premium or my own account in the report?
No. Every slot in Circleboom's report can be a public X account that is not yours, and adding your own is optional. When you do include it, your own account never consumes a Competitor Token, and a paid plan on X has no effect on which columns appear for other accounts.
Where do the numbers on someone else's X account come from?
They come from official X API records, retrieved by Circleboom, a verified Enterprise partner of X, not from scraping. Gender and language breakdowns are calculated by Circleboom from profile data in those records and describe the audience as a group. The wider trust question is covered under is Circleboom safe.
How much history sits behind another account's figures?
The report reads up to about 3,200 of each account's most recent tweets, not its full history. I always check the post dates first, because that many posts can span a few months for a heavy publisher and several years for a quiet one.
Does running the report again replace the earlier one?
No. A new run on Circleboom produces a new dated set of profile analytics for the same X handles. The earlier one stays under Past Analyses for that saved set.

