
Most answers to this question name a format: threads, video, polls. A format list describes the average account. The tweets that earn the most impressions on your account are the ones your own audience has already stopped for, and you can measure that directly.
Tweets get the most impressions when a strong first line, a format the audience already responds to, fitting media and a well-timed send line up, and the mix differs by account. Circleboom orders your X posts from most impressions to fewest using X's official Enterprise APIs, so the top rows show which kind travels for you.
→ Twitter impressions
The sections below define an impression, list the shared traits, and sort your tweets into four kinds.
What an impression counts on X, and what it leaves out
An impression is one appearance of a tweet on someone's screen. X's own metrics documentation for developers puts it as how many times a post appeared on a user's screen, and adds that the number is not unique. If one person meets the same tweet on three occasions, that is three impressions.
Three consequences follow from that definition:
- A view needs no action. The tweet only has to appear in a timeline, a search result or a notification.
- A scroll-past counts. Passive exposure is inside the number.
- Repeat views by one person stack up.
Likes, replies, reposts and quotes are not impressions. They are engagements, counted in their own columns, and a like does not add one to the view total of the tweet that received it.
Engagement can still raise reach indirectly. When a follower reposts a tweet, it appears in front of that person's followers, and each new appearance is another impression. Video adds one more wrinkle, covered separately in the answer on impressions on shared videos on Twitter/X.
An impression tells you a tweet was shown. It never tells you the tweet was read.
Which traits do high-impression tweets share?
High-impression tweets usually share a small set of traits, and the exact mix is specific to each audience. These are the traits worth checking on any account:
- A first line that gives a reason to stop, such as a number, a blunt claim or a question.
- A format the followers already reward, whether single tweet, thread or reply.
- Media that carries the point instead of decorating it.
- A send time when the audience is online.
- Early reposts, which place the tweet in more timelines.
None of those traits is a guarantee. On some accounts plain text outruns every image, and on others the reverse is true. Published format rankings are averages across other people's followers, and an average hides the one fact a creator needs: what this audience does.
Why format lists and your own Twitter impressions disagree
A format list answers a different question from the one you are asking. It reports what happened across many accounts with different followers, topics and posting habits. Your account has one audience, built by what you have already published.
That audience has habits. Some followings read long threads to the end. Others reward one sharp sentence and skip everything longer. Neither group is wrong, and no outside list can tell you which group follows you.
So the reliable answer has two parts. The traits above are the candidates. Your own ranked tweet history is the proof of which candidates apply to you.
Circleboom sorts the tweets on your Twitter account by impressions, so pulling that proof takes minutes. Rank tweets by impressions and read the top rows for the traits that repeat.

From the Circleboom podcast: a conversation on earning more impressions and more replies on Twitter (X), useful context for the traits listed above.
Why X does not rank your tweets by impressions
X shows impressions per tweet, and it does not order your full history by that number. Its own activity dashboard for posts reports impressions, engagements and engagement rate for individual posts, and the native analytics add a recent summary view.
What is missing is a sort across everything you have published. Without it, finding the all-time top performers means opening tweets one at a time and comparing by hand. That is workable for twenty tweets and hopeless for two thousand.
The practical effect is that most people never see their Twitter impressions in order at all. They know a handful of numbers and assume the rest.
How Circleboom shows which tweets earn the most Twitter impressions
Circleboom's Post Engagement Analytics lists each tweet from your X account as one row and lets any metric column order the whole table. Sort the Impressions column from highest to lowest, and the widest-reaching tweets rise to the top in one click.
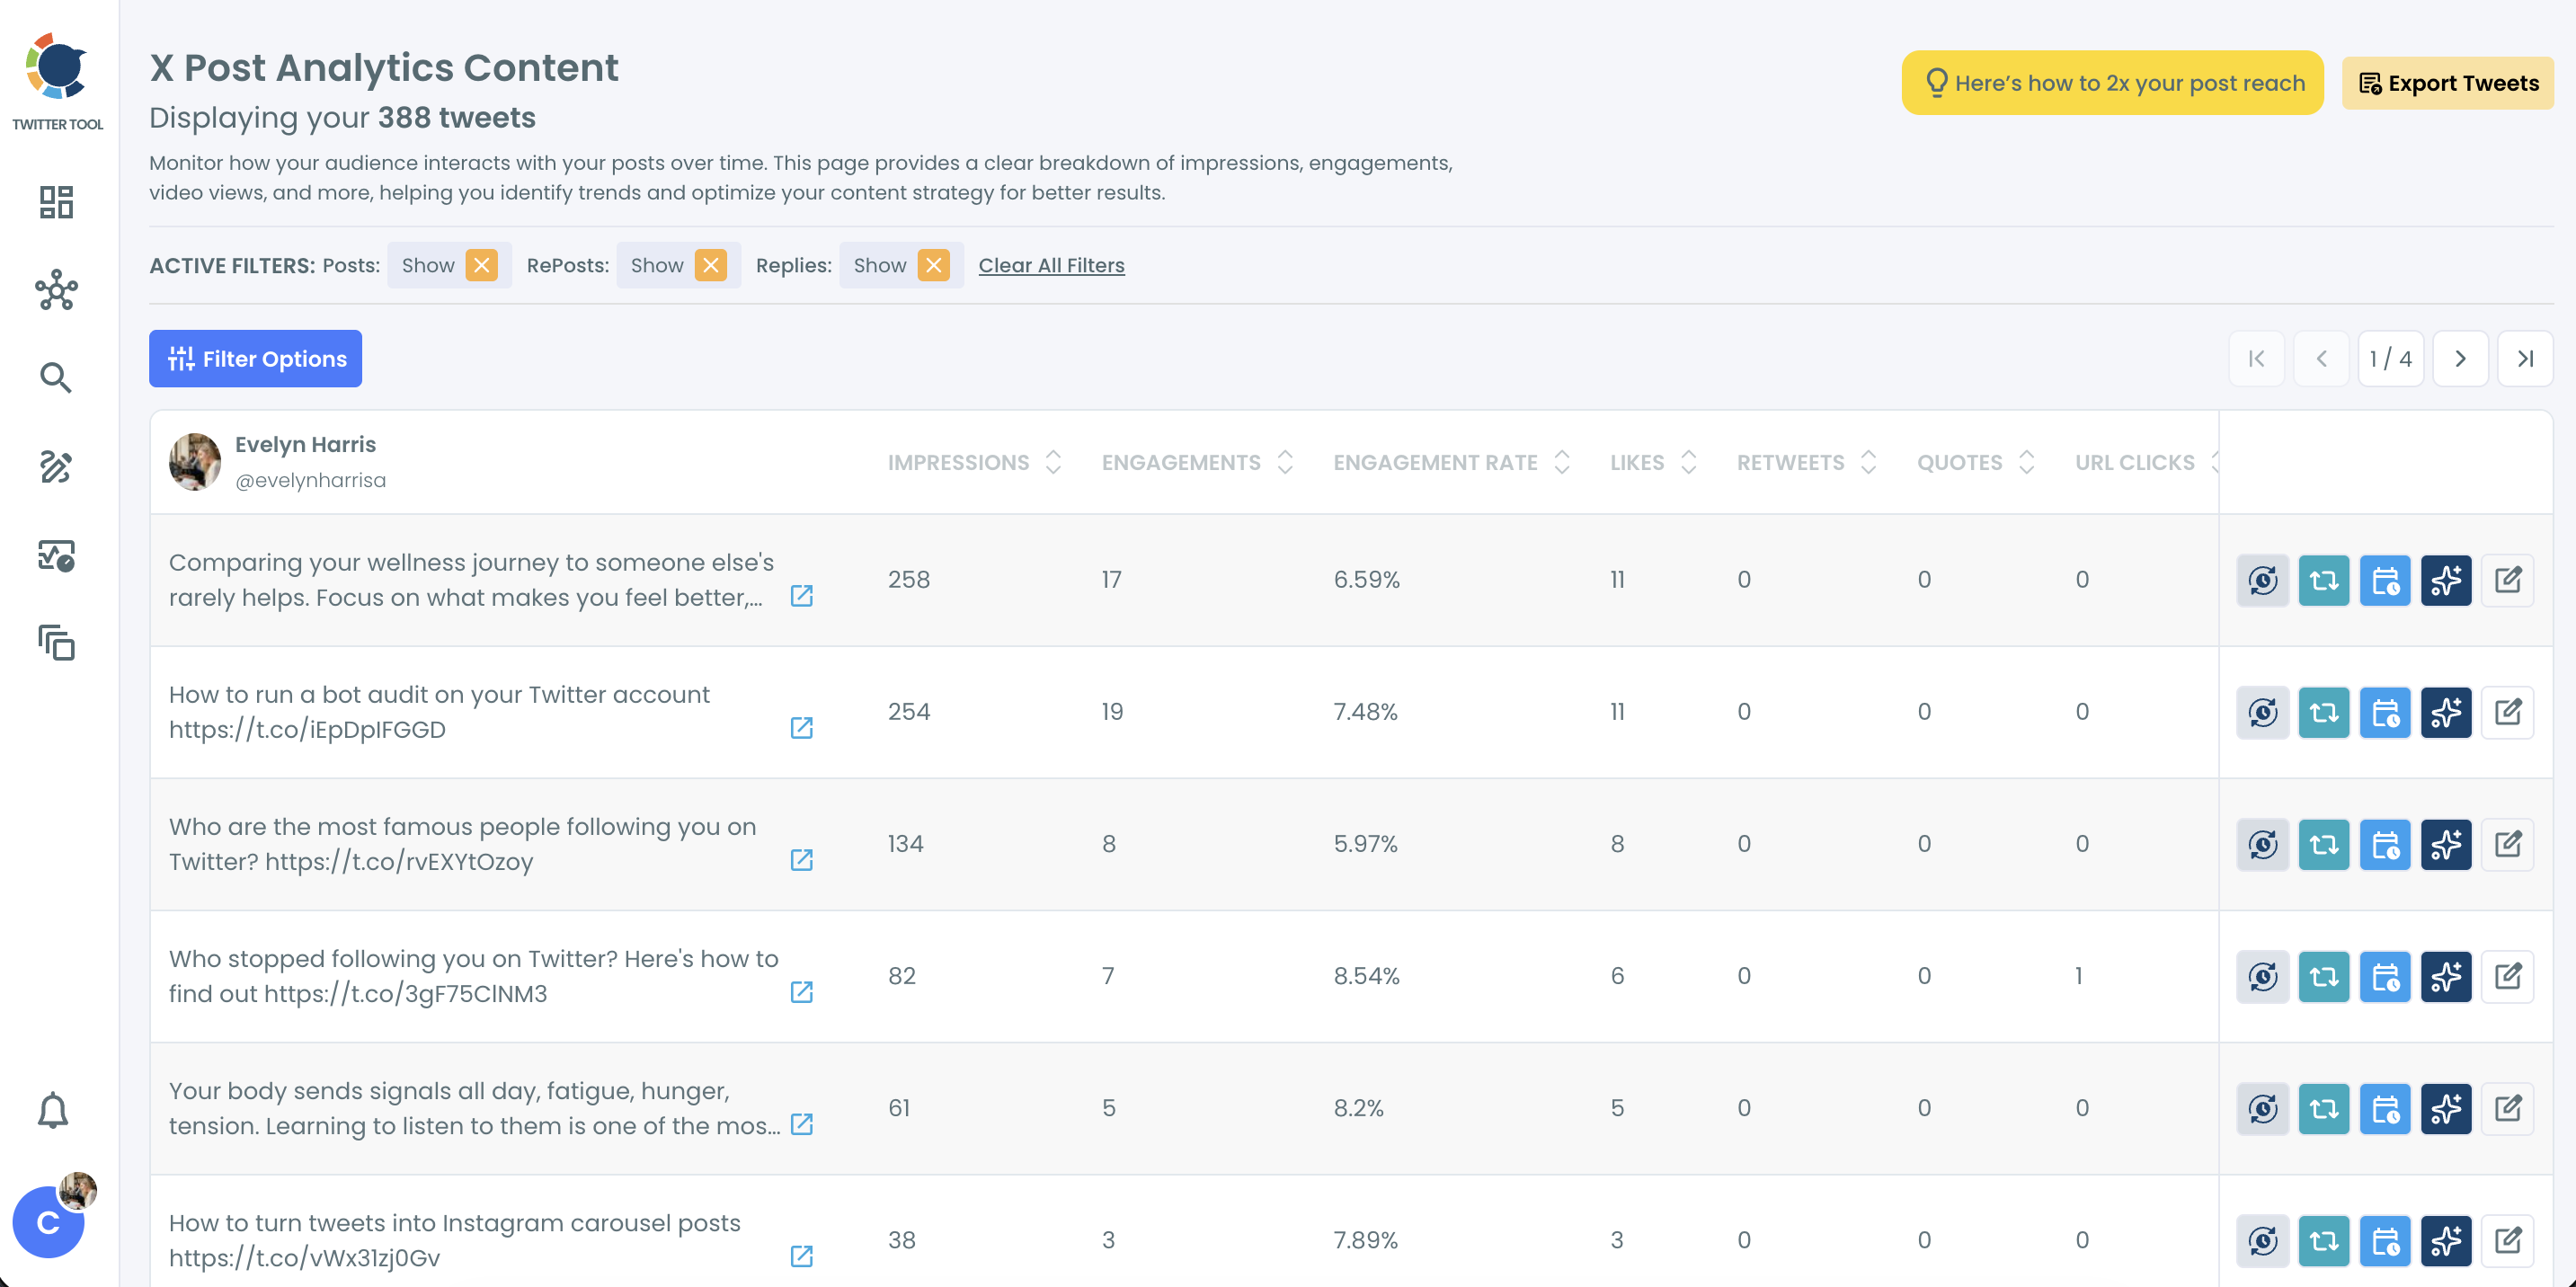
Each row puts the response next to the reach:
- Impressions and engagements.
- Engagement rate, calculated as total engagements divided by impressions.
- Likes, retweets and quotes.
- URL clicks.
Circleboom analyzes tweet performance on X as a verified Enterprise partner of X. That status matters here for a plain reason: the figures in the table are the figures X holds, pulled through approved access, with no scraping of your account.
Filters that narrow the table to one kind of tweet
The Filter Options drawer narrows the table by date or media type, among other fields, so you can check video against video or last quarter against last quarter. Filters narrow what is visible. They do not fetch additional tweets beyond the set that loaded.
For a lighter first look, the free Twitter X Metrics Calculator reports reach, engagement and best and worst posts from an account's last 100 posts. The full table covers up to 3,200 tweets and can be sorted and filtered, which is what a pattern across your Twitter impressions needs.
To sort your Twitter impressions this way, open Circleboom Twitter Management, go to Post Analytics under the X Post Planner menu, and choose Post Engagement Analytics.
Check the period trend before you rank single tweets
Look at the account-level trend first, then at the posts behind it. Circleboom's Post Analytics Overview charts impressions and other metrics over a chosen period, and the same date range can then be applied to the tweet table.
Starting with the trend pays off because of how a rise can happen. A jump driven by one exceptional tweet suggests a different conclusion from steady improvement across several comparable tweets. The overview shows the jump. The ranked table shows which of the two stories is true.
Four kinds of tweet your ranking will show
Every tweet in a ranked table falls into one of four kinds once you read two columns together: impressions and engagement rate. This grouping is the most useful thing I take from the table, because each kind calls for a different next move.
Judge "high" and "low" against your own account average, not a generic benchmark. A tweet at twice your usual engagement rate is strong for you, whatever another account's numbers look like.
| Kind | Impressions | Engagement rate | Next move |
|---|---|---|---|
| Seen and acted on | High | High | Copy the structure, reuse the idea |
| Seen but ignored | High | Low | Keep the topic, rewrite the wording |
| Loved but barely seen | Low | High | Send again at a better time |
| Neither | Low | Low | Review, then leave or clean up |
Seen and acted on
These tweets reached a wide audience and moved it. They are the pattern to study: note what the top rows share, then reuse the structure with new words.
A worked threshold helps. If an account's average engagement rate is 1.2%, tweets at 2.4% or higher are at twice the norm, and the ones that also rank high for X impressions belong in this group.
Check which action they earned. Replies point to conversation, reposts to distribution, and saves to lasting value, which is why it helps to see your most bookmarked tweets alongside the reach ranking.
Older tweets of this kind are the best reuse candidates, since many current followers never saw them. A refreshed version works better than a copy, and Circleboom's AI rewrite for old tweets handles that job.
Seen but ignored
These tweets were shown widely and prompted almost nothing. The topic travelled, and the wording gave nobody a reason to act.
Treat them as half a success. Keep the subject, sharpen the first line, and add a direct question or a clear ask. Raw Twitter impressions flatter this kind of tweet more than any other, which is why it needs the second column.
For link tweets, the gap often shows up in the URL clicks column, and a separate walkthrough explains which tweets get the most clicks.
A high-impression tweet with no response is a distribution result, not a content result.
Loved but barely seen
These tweets earned a strong response from the few people who saw them. One caution applies: a very small sample can produce a flattering rate. A tweet shown to a few dozen people can post a double-digit rate on a handful of actions, and a handful of actions proves little.
When the absolute numbers are respectable, this kind is a hidden gem, and timing is the first suspect.
Neither
These tweets were neither shown much nor acted on. Before judging them, check their age. A tweet from this week is still collecting views.
The rest are information. A cluster of them around one topic or format tells you what your audience skips. The pattern for the next tweets comes from the first kind, and Circleboom can generate your next tweet as a starting draft.
Did posting time cause low X impressions on a good tweet?
Often, yes. A tweet with a high engagement rate and low impressions usually reached a small audience because it went out when few followers were online, not because the idea was weak.
The feature's own playbook gives an illustrative case: a tweet with 900 impressions and a 6% engagement rate, posted at 02:00 local time. The people who saw it responded well. Too few people saw it.
Three checks separate a timing problem from a content problem:
- The engagement rate sits well above the account's average.
- The raw engagement count is large enough to trust.
- The send time falls outside the hours when the audience is usually active.
If all three hold, send the idea again in a peak window. From the table, a tweet can be rescheduled into the X Post Planner for a later slot, and scheduled posts must be set at least 15 minutes in the future.
If the engagement rate is ordinary as well, timing is not the explanation. Look at the hook and the topic instead.
How to read a Twitter impressions ranking without overreading it
A ranking describes what happened. It does not prove what caused it, so a few habits keep the reading honest:
- Use several examples. One viral outlier is weak evidence, and a trait repeated across the top ten is strong evidence.
- Read the replies. A high count can include criticism or questions, and volume is not approval.
- Keep the period and filters noted, so a later comparison covers the same set of tweets.
Metrics in the table reflect the values at the time the data loaded. The figure for a tweet that is still spreading can lag behind X until the data is refreshed.
How often should you re-rank your Twitter impressions?
Weekly is a sensible rhythm for an active account. The pattern in your top rows shifts as followers change and as you publish new work, so a ranking read once goes stale.
A short weekly pass is enough. Filter the table to the last 30 days, sort it, and pick the top five tweets. Assign each one to its kind, then take the matching next move.
I find the habit matters more than the depth. A quarter of small weekly readings teaches more about your Twitter impressions than one long audit, because each reading tests the pattern the previous one suggested.
Summary: the tweets that get the most impressions are the ones your ranking names
The kind of tweet that gets the most impressions is the kind your audience has already rewarded: a hook, format, media choice and send time that repeat across your top rows. Published format lists offer candidates, and your own table settles which ones apply.
Reading impressions beside engagement rate turns one ranking into four groups, each with a clear next move. That pairing is what separates reach that was only seen from reach that produced a response.
→ Check your Twitter impression ranking
What people ask about tweets and impressions
Should I delete tweets that got almost no impressions?
Only if they hurt the timeline you want visitors to see. Sorting the table ascending finds tweets with no likes or retweets, but Post Engagement Analytics is not the deletion workflow. Removal happens in Circleboom's Delete All Tweets, where like and retweet count filters select the low performers on your X account.
How far back can a ranking of my tweets go?
Up to the 3,200 most recent tweets, which is what X's API returns for a connected account. Impression data may also be missing for tweets posted before the account connected to Circleboom or outside X's analytics retention window, and those rows show no engagement rate.
What is a good engagement rate for a tweet with high impressions?
The figures usually quoted for X are 1% for a good tweet, 2 to 3% for a strong one and 5% or above for an excellent one. Your own average is the better yardstick, and I would trust a tweet at twice your usual rate over one that clears a generic line. Circleboom's blog has more on how to improve your Twitter engagement rates.