Most advice treats a Twitter SWOT analysis as four boxes to fill, so every number about a rival ends up in one of them. For X accounts, the more useful job is deciding which numbers qualify for a quadrant and which belong in none.
A SWOT for an X account puts measured gaps against direct competitors under strengths and weaknesses, and rival moves or open market space under opportunities and threats. Circleboom compares up to 5 X accounts across 9 report sections through the official Enterprise APIs of X, so every quadrant reads from the same dated data. A metric that comes back flat for every account belongs in no quadrant.
→ Twitter SWOT analysis
Below: each quadrant, the metric that qualifies for it and the metric that does not.
What a Twitter SWOT analysis is when the subject is an account
A Twitter SWOT analysis of an account is a four-quadrant comparison of that account against named competitor accounts on X. It is different from a SWOT of X the company, which is what most published examples cover.
The grid has two axes. One separates what is inside your control from what is outside it, and the other separates what helps from what harms.
For an account, the four quadrants read like this:
- Strengths: where your account measurably leads its direct peers.
- Weaknesses: where it measurably trails them.
- Opportunities: space that rivals or the market have left open.
- Threats: rival or market movement that works against you.
A SWOT is an input to planning, not the plan. It feeds the positioning and objective-setting work described under strategic marketing, and it is only as good as the comparison behind it.
That comparison is the hard part, because a profile page carries no audience breakdown and no per-post averages. A defensible SWOT analysis of your Twitter account needs the same fields for every account, pulled on one date.
Where the data for each quadrant comes from on X
The data for all four quadrants can come from one benchmark report. With Circleboom's X Competitor Analysis & Benchmark Report tool, you can place your own X account next to up to 4 competitors, or compare up to 5 other accounts, in a single dated run.
The report has 9 sections, and each one shows every account side by side:
- Who each audience is: the essentials table, audience quality, and demographics with geography.
- How each account publishes: posting behavior, plus content type and format.
- What came back: engagement, impressions, content leaderboards and video performance.
Setup is short. You enter the handles under Account Handles, select Start Competitor Analysis, and choose between one report and a monthly schedule. Accounts must be public and under 3,000,000 followers.
Sourcing is what lets a quadrant survive a challenge. Circleboom is one of the companies on X's official Enterprise developers list, so the records are retrieved through the API and never scraped. The classifications and breakdowns are Circleboom's calculations from those records.
That combination makes a Twitter SWOT analysis repeatable: same accounts, same fields, new date.

To see the output before running your own, open the sample X Competitor Benchmark Report, which shows every section on real accounts.
What belongs in the strengths quadrant for an X account
In a Twitter SWOT analysis, a strength is a per-post or audience-composition lead over direct peers, stated with its basis. Size alone does not qualify.
Metrics that qualify:
- A higher engagement rate than the peer set.
- Higher average impressions per tweet.
- A larger active share or High quality tier in the audience.
- Posting hours that overlap the audience's active hours more closely.
Basis matters for the first one. X's own documentation for the tweet activity dashboard defines engagement rate as engagements divided by impressions. Circleboom's report uses the same basis: total engagement divided by total impressions.
So the rate describes how often people who were shown a post interacted with it. It is not a follower-based figure, and it should never be quoted as one.
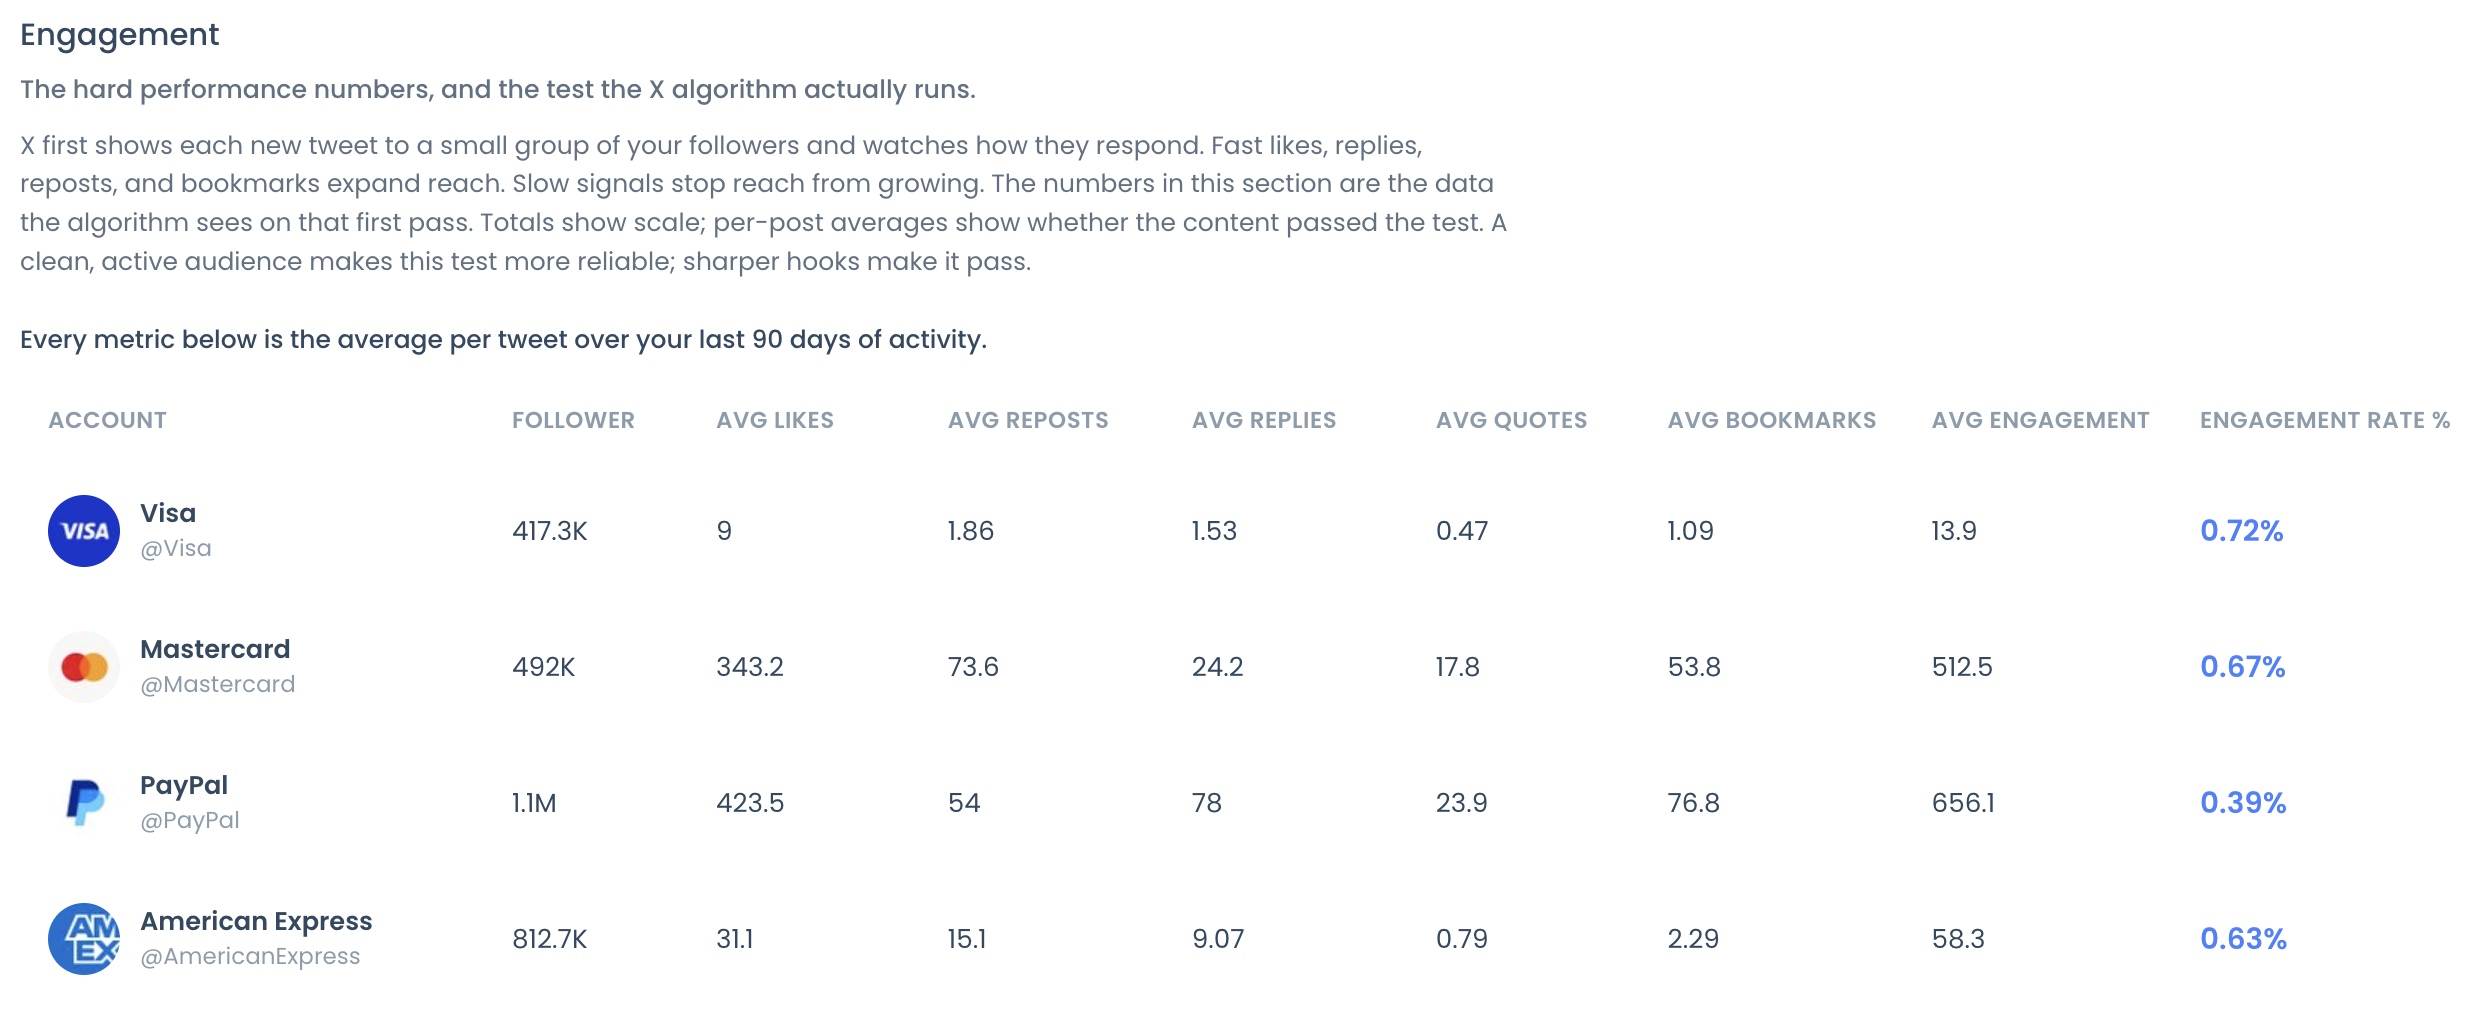
The Engagement section of the report is where most strength lines are confirmed. Its summary table lists per-post averages for each interaction type next to the engagement rate.
What stays out of the strengths quadrant
Metrics that do not qualify:
- Raw follower count.
- Monthly totals that are higher only because you post more.
- One standout post.
The last one deserves a check. Compare the per-post average with the top tweet head-to-head panel, because an account whose average is carried by a single post has a lucky week, not a strength.
A useful illustration: two accounts each earn 1,000 engagements, one from 20,000 impressions and one from 100,000. The first has a 5% rate and the second 1%, so the "equal" accounts are far apart on efficiency.
What belongs in the weaknesses quadrant on Twitter
A weakness in a SWOT analysis on Twitter is a measured gap against direct peers whose cause you have confirmed in a second report section. An unexplained gap is still a question.
Metrics that qualify:
- A lower per-post average with comparable cadence.
- A format that takes most of your production effort but never appears among your top posts.
- A posting schedule clustered outside your audience's active hours.
- A thinner active share than the peer set.
The second-section check exists because one number points at many causes. Low engagement can come from a diluted audience, lower output, a format mismatch or timing, and each has a different remedy and a different cost.
Three things do not belong here.
A gap against a category leader stays out. Leaders are references to study, and their totals are not targets for a smaller account. For that kind of study, see 4 brands that are perfect examples to learn Twitter marketing.
Classification labels stay out too. Suspected bot, inactive and low-tier labels flag profiles for review, and someone who seldom posts can still be a loyal reader.
A low-performing post needs its own context before it counts. The under-performers panel is relative to each account's own range, so read a weak post against that account's typical results.
Is a bigger follower count on X a strength for a competitor?
No, not on its own. In a Twitter SWOT analysis, a larger follower count is context, and it becomes a strength only when the active share and the quality tiers behind it also lead.
A follower total only ever accumulates. Nothing removes the people who stopped posting years ago, so an older account carries all of them.
Account age shows how much of a lead is simply time. In an illustrative pair, a 10-year-old account with 100,000 followers grew by about 833 a month, while a 1-year-old account with 12,000 grew by 1,000 a month. The smaller account is the faster one.
The report prints an ACTIVE FOLLOWERS percentage beside the follower count for this reason. Its Audience Quality section then splits each audience along several lines, including:
- Human against suspected fake or bot.
- Active against inactive.
- High, Medium and Low quality tiers.
The report's own Audience Quality page explains why this matters for reach. X first shows a new post to a small group of the account's followers, and fast engagement from that group expands distribution.
A large audience full of quiet accounts can fail that first test even with good content.
So read composition first and size second. If a rival leads on followers and trails on active share, the follower line belongs in no quadrant, and the active share may belong in your strengths.
What belongs in the opportunities quadrant for X accounts
In a SWOT analysis for X accounts, an opportunity is open space: something your audience responds to that direct competitors are not doing, or a segment none of them holds. It sits outside your account, which is what separates it from a strength.
Findings that qualify:
- A format with strong results for a rival that the rest of the set barely uses.
- A posting window when your audience is active and rivals are quiet.
- A country or language segment present in a rival's audience and missing from yours.
Timing is the easiest to picture. If three competitors all post between 09:00 and 11:00 and your audience is also active at 20:00, the evening slot is a less contested window.
Two findings do not qualify. "Copy what the leader does" is not an opportunity, because the report shows format investment and format results as separate panels, and heavy investment does not guarantee response.
Audience presence is not demand either. A segment in a competitor's follower list shows representation in that market and says nothing about buying intent.
Opportunities also depend on what the platform can return for your kind of business in the first place. For that wider frame, the benefits of using Twitter for business is the background read.
What belongs in the threats quadrant on Twitter
In an X account SWOT analysis, a threat is rival or market movement that works against you and that you do not control. It has to be sustained to qualify.
Findings that qualify:
- A direct peer whose per-post averages rise across two or more dated runs.
- A rival whose audience is concentrated in your home market.
- A shift that hits every account in the set at once.
The third one is easy to misfile. When cadence or engagement drops across the whole peer set, the cause is the category, and the finding is a threat. When it drops in your column alone, it is a weakness.
A one-month spike does not qualify. If a single month lifts a rival's whole chart while the per-post average stays level, the cause is one outlier post, and the rival's strategy has not changed.
I treat the follower gap the same way here as in the strengths quadrant. A rival's larger list is not a threat until its active share and engagement rate say so.
Outside threats and opportunities on X: what five accounts cannot show
Outside threats and opportunities come partly from the wider conversation on X, and an account-level benchmark does not listen to it. The report compares up to 5 named accounts; it has no view of topics, complaints or newcomers beyond them.
Part of each outside quadrant sits beyond the compared set, so a Twitter SWOT analysis filled only from rival accounts leaves its opportunities and threats boxes incomplete.
Topic-level listening is a different job with different tools. In Circleboom, keyword and hashtag monitoring runs through tweet search, and the Twitter hashtag and keyword tracker is where to begin.
Two search modes cover the two time directions. Historical Tweet Search looks through past public tweets by keyword and date range, which shows how long a complaint or a topic has been building.
Real-time Tweet Search follows live activity from a chosen start date onward, including tweets posted after the search is set up. A real-time tweet tracker is the right fit for an emerging threat you want to keep watching.
From the listening side: a podcast episode on keyword monitoring for Twitter/X.
What to listen for outside the compared accounts
Listen for three kinds of signal, and sort each one as it arrives:
- Repeated complaints about your category, which are threats to everyone in it and opportunities for whoever answers first.
- New account names that keep appearing around your keywords, which are candidate rivals for the next run.
- Topics your audience raises that no compared account covers, which are opportunities.
Reading tone at scale is its own discipline. For the method behind it, see what is data mining and sentiment analysis on Twitter.
When a new name shows up often enough, give it a slot in the next comparison. That is how the outside half of the grid feeds the inside half.
Metrics that belong in no quadrant of an X account SWOT
When every compared account returns nearly the same value, the metric cannot support a line in any quadrant. It separates nobody, so effort spent on it buys no relative position.
Circleboom's documented sample comparison of four large brands shows the pattern. The verified share of followers and the active share each stayed within a couple of points across all four accounts, while suspected bot share and the High tier spread widely.
The spread is where quadrant lines can be written. The flat metrics end an argument instead: stop looking there.
Two more kinds of figure stay out of the grid:
- Context figures, such as account age and raw follower count, which explain other numbers without being findings.
- Figures quoted in the wrong unit, such as a per-500-tweets hashtag value read as hashtags per tweet.
Knowing which battles have no prize saves as much time as knowing which ones do.
Your checklist for a four-quadrant SWOT of an X account
A Twitter SWOT analysis is finished when every line has a section, a date and a basis behind it. Work through it in this order:
- Choose direct peers, and keep the same set for every later run.
- Write strengths and weaknesses from per-post figures, never from totals or follower counts.
- Fill opportunities and threats from rival behavior, then add what keyword listening finds outside the set.
- Delete every flat metric and every unexplained gap.
- Pick the single largest gap and attach one action to it.
The last item is the one I would not skip. A grid with no first action is a description, and a description changes nothing in next month's numbers.
Because Circleboom is an official Enterprise partner of X, each line you keep can be traced to official records on a stated date.
→ Start your four-quadrant SWOT for X accounts
What people ask about SWOT quadrants for Twitter accounts
Should I compare my account with direct rivals or with the biggest names in my category?
Compare with direct rivals. Pick accounts that share your target market, language, scale, publishing purpose and business model, and treat category leaders as references to study. If you need to find those peers first, Circleboom's X account search tools are the place to look.
Does running the report again replace the data behind my earlier SWOT?
No. A new run produces a new dated comparison, and earlier runs stay under Past Analyses for that saved set. You can re-pull manually with Get a new report with the latest X data, or let a monthly schedule do it.
Can the report show which followers I share with a competitor on X?
Yes, one competitor at a time. In the Common Audience panel you select your account and a rival and read how many followers and followings you have in common. Any shared-audience figure in a quadrant then belongs to a named pair, never to the whole set. Circleboom has a separate Compare X (Twitter) Accounts tool for accounts that are not in the report.
What does a monthly SWOT rerun cost in tokens?
Your own account never consumes a Competitor Token, because the charge falls on each competitor, once for every report. Five competitors on a 12-month schedule is 13 reports, which comes to 65 tokens.
What is the most common mistake when filling the quadrants?
The one I see most is the same finding written twice, once as "their strength" and again as "our threat." Each finding about a Twitter account gets one quadrant. If it describes your column, it is internal, and if it describes a rival's move, it is external.