

What goes into a monthly client report on X when the client can already open their own analytics? Not the same charts with your logo on top.
The part a client cannot produce alone is the view of their account next to the rivals they worry about, repeated on the same terms every month.
A monthly client report holds up when it shows the client beside the same named peers each month. Circleboom produces that benchmark for agencies on X, retrieving every account's records through official X Enterprise APIs and repeating the run on a monthly schedule.
→ Twitter reporting tools
The seven steps, the reading order and the one slide worth leading with follow below.
Why a monthly X client report needs more than the client's own numbers
A report made only from the client's analytics is a scoreboard with one team on it, and many Twitter reporting tools produce exactly that. The score is real, and nobody can tell who is winning.
I have built reports that way, and they share a weakness. Each month reads as a list of what happened, with no way to say whether it was good. The client nods, and the retainer conversation gets a little harder each quarter.
The client's native analytics are still the right first stop for their own record. If a client needs a primer on reading them, the walkthrough titled Twitter analytics: a step-by-step guide for marketers covers that ground.
The gap is everything outside that one account. Hand-built comparisons try to fill it, and they fail a simple test: each number was collected a different way. Once a client asks how many posts a figure rests on, the slide is finished.
Good Twitter reporting tools for agencies remove that argument by pulling the same fields for every account on one date.
On screen: checking one account's own tweet statistics, the single-account view that a benchmark then sets beside peers.
https://www.youtube.com/watch?v=NxruclL0uCg
What the Circleboom benchmark adds to an agency's Twitter reporting
The X Competitor Benchmark Report tool adds the peer view. With Circleboom, you can compare a client's X account with up to 4 competitors in a single report, and every section renders each account in the same layout.
The source is the reason the report survives a client's questions. Circleboom is one of the companies on X's official Enterprise developers list, so the underlying records are retrieved through X's official API. Your deck carries figures you can trace, which protects the agency as much as the client.
Circleboom then calculates the report's metrics and audience classifications from those records. Present those as Circleboom's analysis, not as verdicts issued by X.
What the nine sections cover
The report follows the same nine-part structure for every client, which is what makes two months comparable. It opens with the essentials table, and the other eight parts answer three client questions:
| Client question | Report parts |
|---|---|
| Who is listening? | Audience quality; audience demographics and geography |
| How does each account publish? | Posting behavior; content type and format |
| What came back? | Engagement; Impression/Views; content leaderboards; video performance |
Most Twitter reporting tools stop at the engagement and impressions of one profile. Here the audience behind each follower count sits in the same document as the results, for every account in the set.
Two dates to keep apart
Every report has a run date, and the posts inside it have their own dates. What the audience counts and composition show is the audience as it was retrieved on the run date. Engagement and impressions describe the analyzed posts.
That difference matters in a monthly deck. A calendar-month chart and an average across the retrieved sample are two views, so label which one a slide shows.
One boundary shapes every reading. X's API documentation describes the user Posts timeline as returning up to 3,200 of an account's most recent posts. The report's tweet-based sections rest on that same recent window.
For an agency on a monthly retainer, the scheduling option is what makes this a reporting tool for X client reports and not a one-time audit.
What to decide before you build the Twitter report
Decide the peer set before you open any X reporting tool. The comparison defines what winning means, so the choice of accounts is a strategy decision made before any data is read.
Choose direct peers, not category giants
Direct peers share the client's working conditions. Check each candidate against these five traits:
- Target market.
- Language.
- Account scale.
- Publishing purpose.
- Business model.
Category leaders are a different kind of set. They are useful for studying approaches and misleading as targets. A regional support account and a global entertainment-led brand can share a sector and still serve different goals.
State which kind of set you used on the first slide of the first report.
Agree the set with the client in writing
Get the client to name the rivals they care about, then add or trim to reach three or four direct peers. Write down why each account is included.
That short note pays for itself later. When someone new joins the client's team and asks why a famous brand is missing, the answer is already on file.
How to build a monthly Twitter client report step by step
The process, in order, from an empty screen to a branded deck.
Open the report and enter the client's peer set
- Log in to Circleboom Twitter and connect the X account you report from.

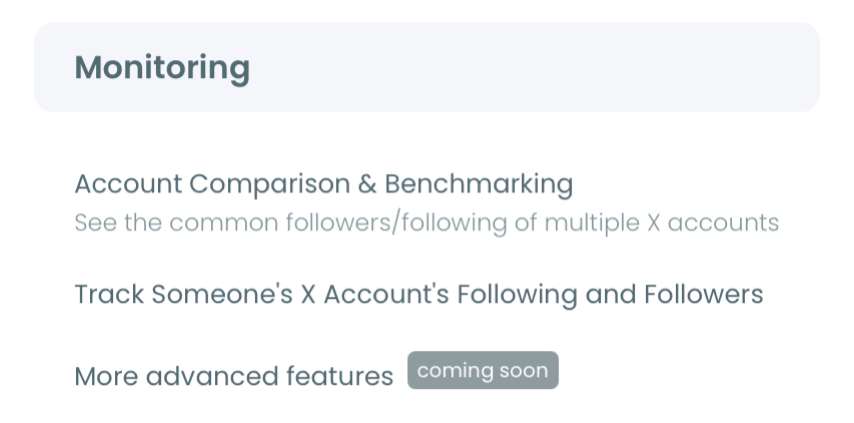
- Move to the Monitoring menu, where X Competitor Benchmark Report is the top entry, and open it.
- Enter the client's handle and the agreed peers in the Account Handles panel. Add slots with the + button and watch the "of 5 competitors added" counter.
Run the baseline and schedule the months that follow
- Select Start Competitor Analysis and choose Keep it up to date every month. Set the MONTHS selector for the length of the engagement and FIRST MONTHLY REPORT ON for a day shortly before the client's review.
- Open the first report with View report and treat it as the baseline. Read Audience Quality before you trust any follower count in the essentials table.
Find one gap and turn it into the client deck
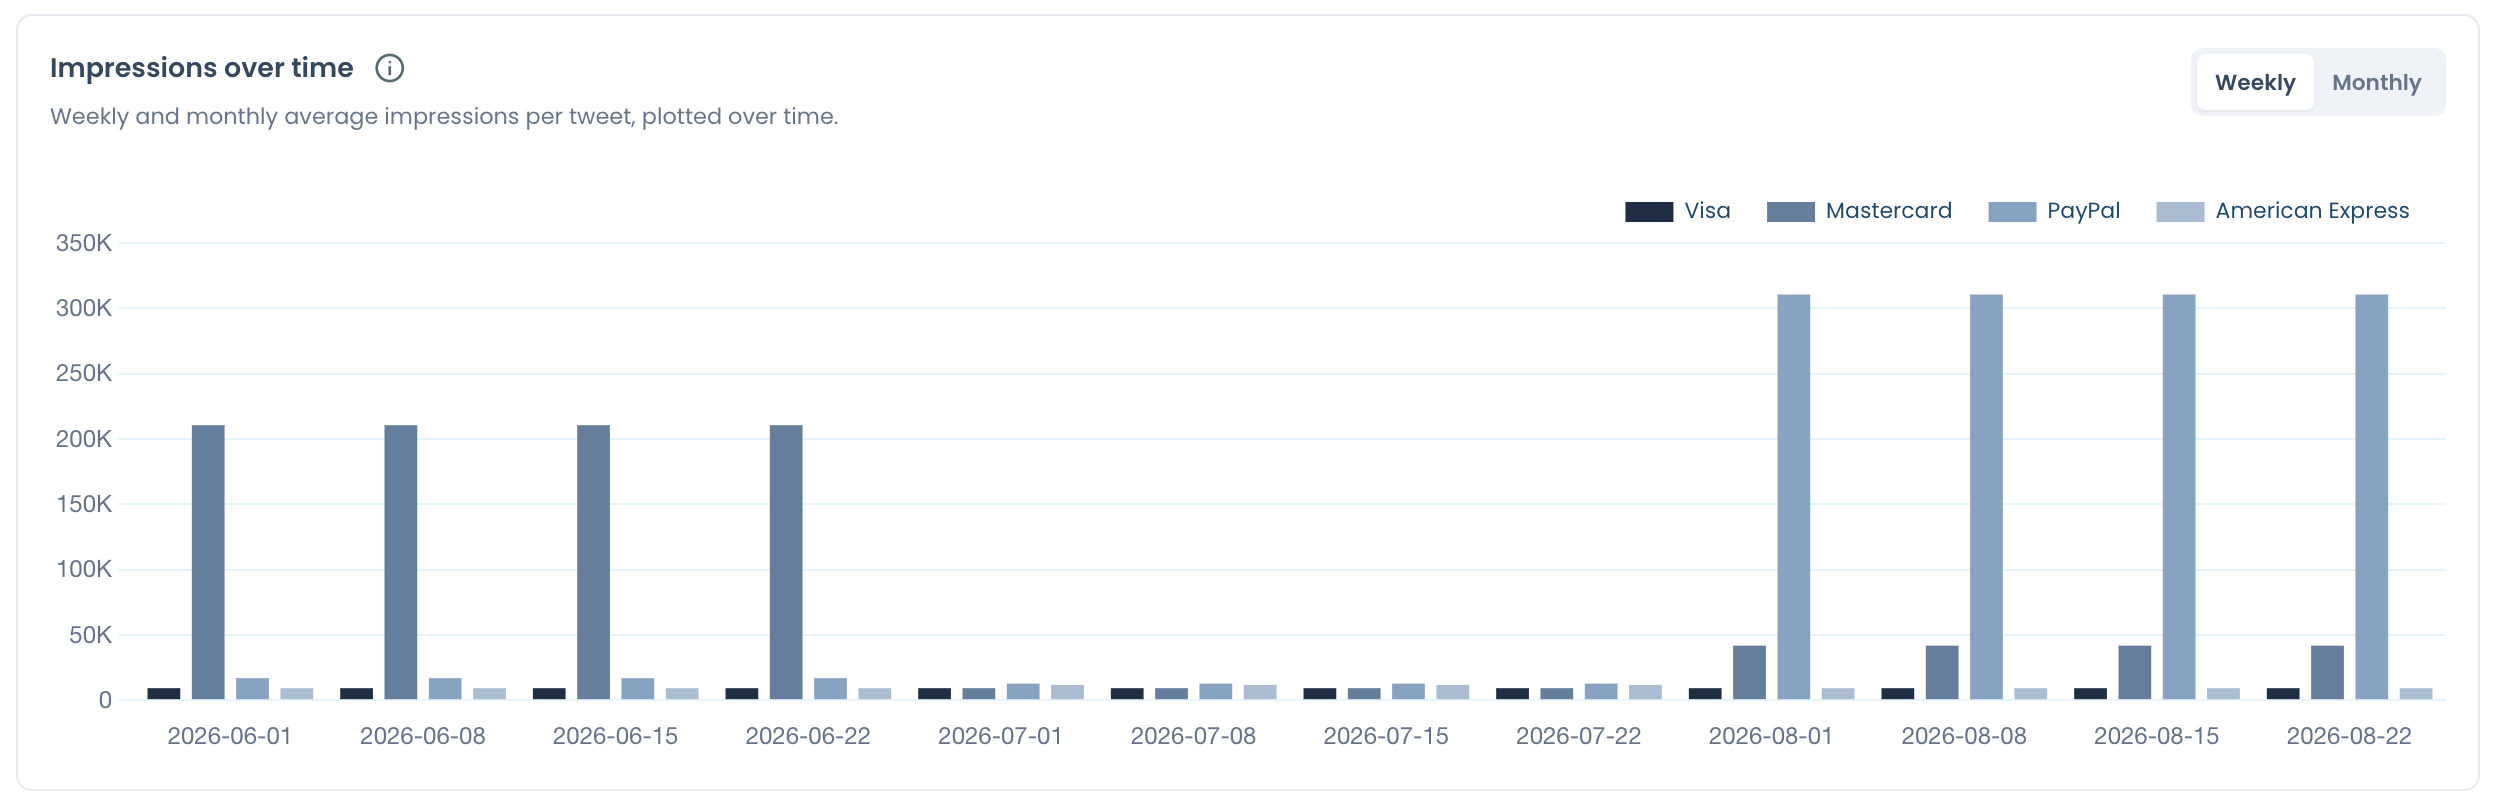
- Identify the largest gap the client can act on. Check the Impression/Views charts to see whether a lead is sustained or a single spike.
- Select Create Branded Presentation to export a logo-carrying deck from the current report.
This order protects the series.
The peer set is fixed before any number is seen, the baseline exists before any change is claimed, and the deck is built only after one gap has been chosen. Reverse any pair and the report starts answering to the data instead of to the client's decision.
Which numbers should a client report on X lead with?
Lead with the number that matches the client's question, not with the biggest one. No Twitter reporting tool can make that choice for you.
Impressions describe display volume. Engagement describes recorded interactions. A client chasing awareness starts with the Impression/Views section, and a client chasing discussion or sharing starts with the engagement metrics.
Neither wins by default. Read both before you judge a month, because a rising total can come from more posts instead of better ones.
For a refresher on the individual measures, the post on key Twitter performance metrics: tracking your success is a good companion to this section.
The reading order for "are we behind?"
In a first report, clients ask whether they are behind. Read three sections in this order:
- The essentials table, for scale.
- The Engagement summary, for per-post averages.
- Impression/Views, for whether the posts were shown at all.
The cross-check is per-post average against posting cadence. A rival ahead on monthly totals and level on per-post averages is ahead on volume, not on content. Those two gaps cost different amounts to close.
The trap is answering from the essentials row alone. It holds a follower count, one engagement rate and one average impressions figure, and none of the three explains itself.
The reading order for "what changed since last time?"
From the second report on, the question becomes what moved. Open the two dated runs for the same saved set and compare the same sections in this order:
- Per-post averages.
- Monthly totals.
- Audience composition.
Per-post averages come first because totals move with post count. A change that shows up in the average is the one worth a slide.
Check the sample before you name a cause. Each run refreshes a rolling window, so a figure can shift because new posts entered or older ones dropped out.
The "one gap, one action" client slide
The slide I would put first in every monthly deck has three boxes: the gap, the evidence and the action. Nothing else.
| Gap you chose | Section that proves it | The one action |
|---|---|---|
| Audience quality | Audience Quality | Audience review |
| Timing | Posting-vs-audience timing alignment | Scheduling change |
| Content format | Content Type & Format, with the leaderboards | Content planning |
| Reach | Impression/Views | Topic and timing review |
| Video | Video Performance | Video production |
One gap per month keeps the client's attention on a decision instead of a dashboard.
Pick the row with the largest difference the client has the resources to close. Park the other rows in the appendix, and bring one forward next month if the first has moved.
This report works out engagement rate by dividing total engagement by total impressions. Say so on the slide whenever a rate sits beside a follower count. If the client wants the definitions behind each measure, Circleboom's page on Twitter key performance metrics lays them out.
How to brand the Twitter report and get the data out for the client deck
Yes, you can put your agency's logo on the report. Create Branded Presentation builds a brandable, logo-carrying export from the report you have open, ready for a client review or a monthly benchmark deck.
Branding is the easy half. The half that earns the retainer is what you write next to each chart.
Connect every chart to an example and a decision
A branded deck should tie each observed difference to one relevant example and one practical decision. Two patterns cover most months:
- A timing recommendation shows audience activity next to publishing alignment.
- A format recommendation shows format results with the supporting posts.
Keep the account set, the run date and the sample context visible on every slide that carries a number.
Show the client the layout before the first review
Send the public Twitter competitor analysis sample report ahead of the first meeting. A client who has seen the structure spends the review on the findings and not on the format.
Any figure in a sample comes from a report run on public accounts and shows what the report displayed at that time. It is never a current fact about a brand.
Pull raw numbers into your own dashboard or files
For the agency's own records, the branded deck is not the only output. For figures from a connected account, you can also run a Twitter analytics export and store them with that month's report.
Label every export with its run date and account set, and note the sample it rests on. Next month's comparison depends on them.
How the monthly routine runs after the first Twitter report
From month two, the X reporting tool does the collecting and your work moves to interpretation. The scheduled run arrives on the day you set, under Your saved analysis, with a SCHEDULED badge on the client's card.
When a campaign ends between scheduled runs, press Get a new report with the latest X data for an off-schedule pull. It adds a new dated run and leaves the earlier ones under Past Analyses.
Six months of dated reports show the month a competitor accelerated. That is the point where a monthly series starts paying back: you can open that month and check what changed.
Fitting the report into the rest of the agency week
The report is one task in a crowded week. Teams that struggle with it usually have a process problem upstream, and the post on social media managers seeking efficient team workflow solutions speaks to that side.
Client count multiplies everything. Each client needs their own saved set, their own review date and their own peer note.
If you also publish for those clients, a separate article explains how to manage multiple Twitter accounts without mixing them up.
Among the Twitter reporting tools an agency pays for, the ones that last are those that take a recurring task off someone's calendar. A schedule that produces the next dated report on its own does that.
What an agency risks without a benchmark in the X client review
Without a peer benchmark, every monthly review rests on the client's goodwill. A flat month looks like your failure even when the whole category went flat, and you have no evidence to say otherwise.
With one, the same flat month becomes a finding. Five accounts pulled on the same date show whether a dip hit the client alone or everyone in the set, and those two readings lead to different decisions about budget.
I would not send a first report without it. The cost of setting up one saved set is small and fixed, and the cost of a client quietly concluding that the channel is not working is the retainer.
The Twitter reporting tools you choose decide which of those two meetings you walk into.
→ Build your first monthly Twitter reporting tool run
What to know before the first client report on X goes out
How do I report a client's own progress with no competitors in it?
Use Circleboom's single-account Account Analysis Report, found under Followers / Following Management & Analytics in the Analytics group. It answers how an X account is doing on its own, while the benchmark answers how it compares with a named rival.
What does a year of monthly reports cost per client?
Competitor Tokens are charged per competitor, per report. Five competitors on a 12-month schedule is 13 reports and 65 tokens, and your own connected account never consumes a token, so the setup screen in Circleboom shows the exact count for your X account set before you start.
What if a rival's X account is private or has millions of followers?
Only public accounts can be analyzed, and an account with more than 3,000,000 followers cannot be added to a Circleboom comparison. Replace that rival with the next most relevant direct peer and record the reason in your peer note.

