
Most impressions benchmarks hold your account up against a generic table of "good" numbers by follower count. That comparison is unfair in both directions, because a table knows nothing about your category, your rivals or the month you are asking about.
What makes a Twitter impressions benchmark fair?
A fair benchmark compares the same impression figures for named accounts, retrieved on one date and read on one basis. Circleboom puts the monthly total and the per-tweet average of up to five accounts on X side by side through official Enterprise APIs.
→ Twitter impressions benchmark
The three impression figures in a Twitter benchmark and what each cannot tell you
A Twitter impressions benchmark rests on three different figures, and each one answers a different question. Quoting one of them as if it were another is the most common way a comparison turns unfair.
Circleboom's X Competitor Benchmark Report shows all three for every account in the set. The table below sorts them by what they can and cannot settle.
| Impression figure | What it is | What it answers | What it cannot tell you |
|---|---|---|---|
| Monthly total | The sum of each tweet's impressions per month | How much display volume an account had in a month | Whether its posts did better or it published more of them |
| Average per tweet | Average impressions each tweet receives across the analysed posts | Who is shown more per post | Whether one standout post is carrying the average |
| Weekly average | Average impressions per tweet, plotted week by week | Whether a lead is steady or a spike | Why the change happened |
The monthly total measures volume, the average per tweet measures efficiency, and the weekly average shows consistency. A fair comparison names which of the three it is quoting.
An illustrative calculation with equal follower counts
Circleboom's guidance for this report carries a worked example, and it is useful as an illustration and not as a measured case. Two accounts each have about 30,000 followers. The competitor averages 15,000 impressions per tweet. The other account averages 4,000.
Divide one by the other and the competitor is shown 3.75 times as often per post, on the same audience size.
When follower counts match and impressions per tweet do not, the gap is about distribution, not audience size.
A generic table keyed to follower count would give both accounts the same target and miss the whole finding. That is the practical argument for a side-by-side impressions comparison on X over a published range.
What counts as an impression on X, and do likes count?
An impression is one display of a post on a screen, and a like does not add one. X's API documentation on post metrics defines impressions as the count of times the post appeared on a user's screen. It adds that the figure is not unique: the same user viewing twice counts as two impressions.
Two consequences follow for anyone comparing accounts.
Impressions are not people. A total of 50,000 impressions does not mean 50,000 different viewers saw the post. The benchmark report makes the same point in its own guidance: impressions are display counts, not a count of distinct people or evidence of business conversions.
Likes sit in a separate field. In the same X documentation, likes, reposts, replies, quotes and bookmarks are listed as their own public metrics next to impressions. A like records an interaction. The display that came before it is what the impression records. Circleboom's blog has a full post on whether likes count as impressions on Twitter.
The documentation also explains why a rival's impressions can be compared at all. It classes impressions as a public metric, visible with any authentication. URL clicks and profile clicks are classed as non-public, available only for posts the account owns. That boundary is why a fair benchmark covers impressions for every account and leaves owner-only numbers out for everyone.
Three conditions that make an X impressions comparison fair
A comparison is fair when the fields, the date and the basis are the same for every account. Break any one of the three and the numbers stop describing the same thing.
Same fields. Every account gets the same figures, calculated the same way. A rival's public view counts set against your private dashboard is two different instruments. X's help page on view counts covers the number shown under posts, which is a per-post figure and not a benchmark.
Same date. A post keeps collecting impressions after it is published, so a number read on Monday and another read three weeks later are not comparable. One retrieval date for the whole set removes that drift.
Same basis. A total is not an average. In the report, the essentials table's AVERAGE IMPRESSIONS column is an average across the analysed posts, never a period total. State which one you are quoting.
A fourth condition sits outside the data: the peer set. I would rather compare with three direct peers than with one famous account. Direct peers work in your market, post in your language and operate at your size. A category leader shows you approaches worth studying, and its raw totals belong to a different scale.
The sample window is part of the basis
The report retrieves up to about 3,200 recent tweets per account, and that window is not full account history. For a heavy publisher, that sample covers a much shorter stretch of the calendar than it does for an account that posts now and then.
So check the post dates each account covers before you compare a month. A fair benchmark states its sample as well as its numbers.
How Circleboom builds the comparison on Twitter
With Circleboom, you can compare your Twitter account's impressions with up to four competitors in one dated, saved report. The report is called X Competitor Benchmark Report and sits first in the Monitoring menu once you open Circleboom Twitter.
Circleboom is a verified Enterprise partner of X, so every figure is calculated from records retrieved through X's own API. For a benchmark, that matters in a specific way: the three fairness conditions above only hold if the collection method returns every post.
Scraping-based collection can miss records, and a missed post changes an average.
Name up to five accounts
The entry panel is headed Account Handles. Each account gets its own @ field, a + button adds another slot, and a counter shows how many of the five are filled. Your own account can take the first slot, or you can leave it out and compare five other public accounts.
Choose one report or a monthly series
After you press Start Competitor Analysis, the report asks whether you want it Just this once or want to Keep it up to date every month. The monthly option produces today's report and then one automatic report each month on the day you pick.
Read the saved, dated report
Each run is stamped with its date and kept under Your saved analysis. A later run of the same set creates a new dated report and does not overwrite the earlier one, so two runs can be read against each other.
That is the full path to a Twitter impressions benchmark with the three conditions built in.

To see every section before running anything, the sample competitor analysis report lays out a finished comparison with example accounts.
On video: seeing Twitter analytics without X Premium, for readers whose plan does not include it.
Access is a common worry at this stage. The report needs a public handle for each account, not a login for any of them. For the related question about your own numbers, Circleboom's blog explains how to check analytics on Twitter without Premium.
How to tell an outlier post from a real lead on X
Check the most-seen posts before you trust an average. An average per tweet can be lifted by a single post that traveled far, and an account with one such post looks stronger than its typical post is.
The report gives two panels for this check. Top 5 Tweets by Impressions lists each account's five most-seen tweets in the analysed window, in side-by-side columns with the impression count beside each. Top tweet head-to-head puts each account's single best post next to the others.
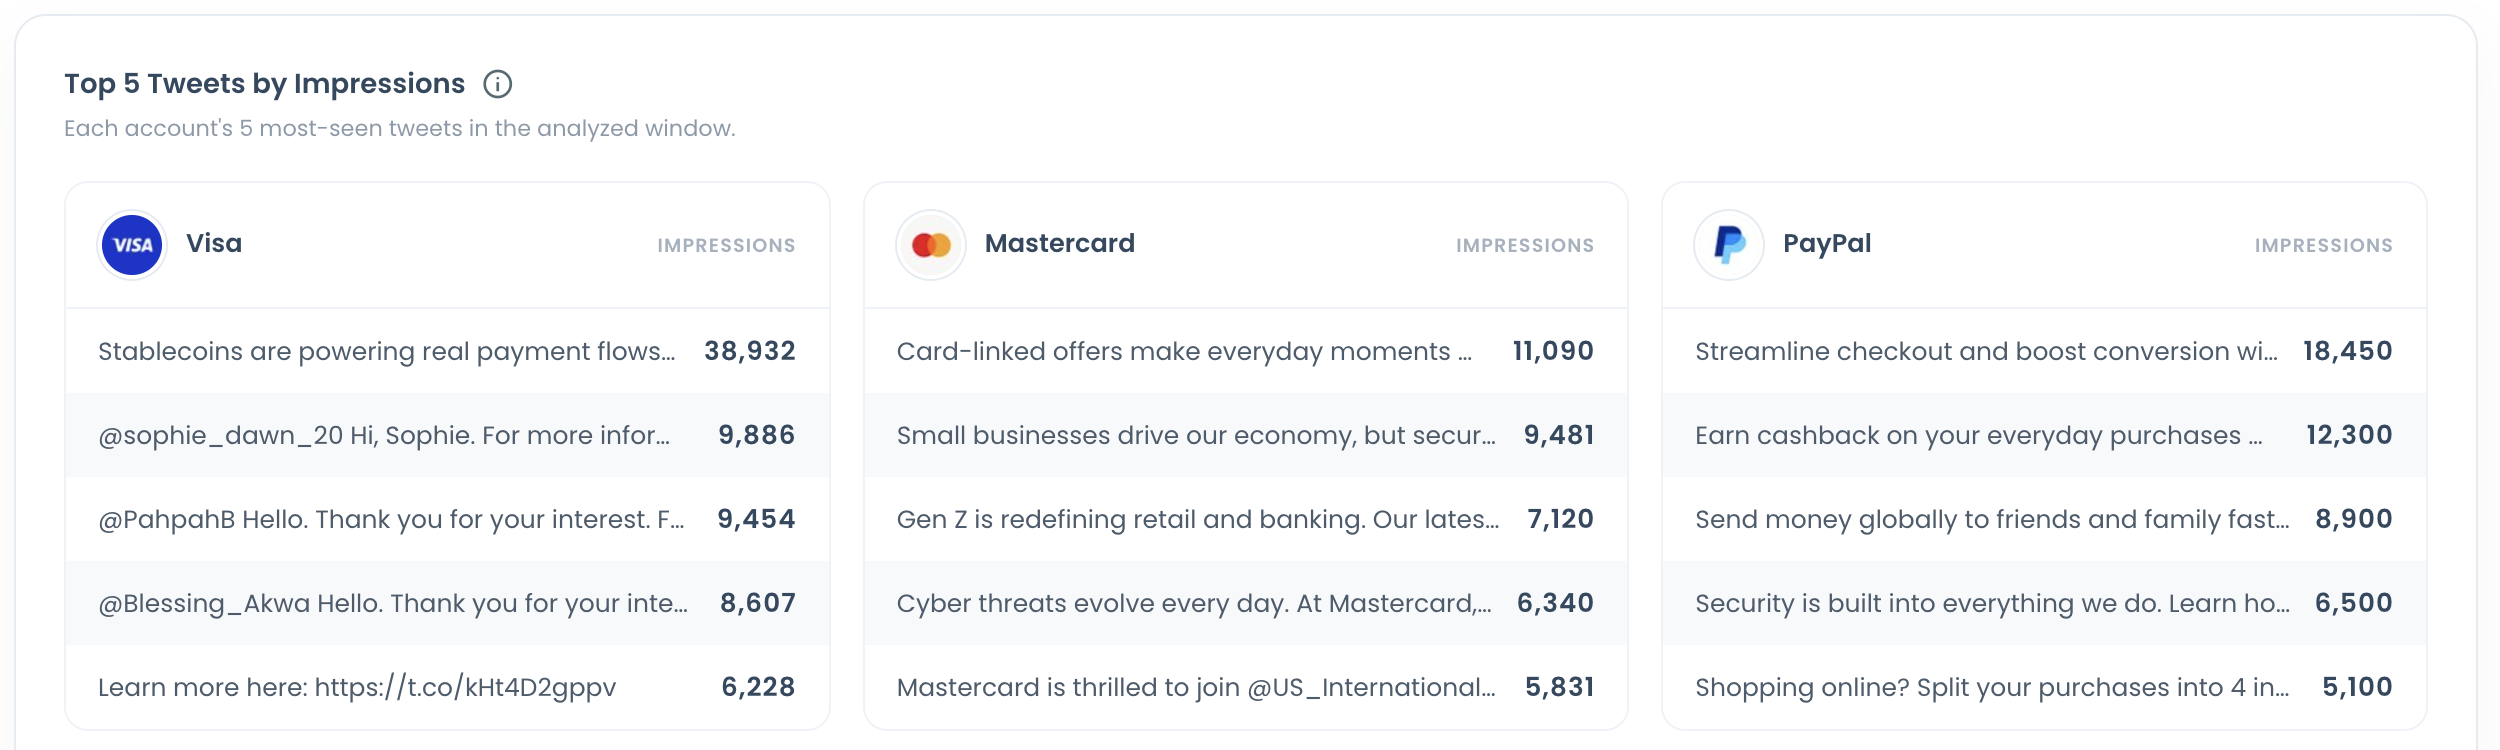
Read the panel like this. If an account's first post sits far above its other four, the average is leaning on that post. If the five are close together, the average describes a habit.
The same panel tells you what kind of post earns visibility in your category. Circleboom's guidance gives the example of a competitor whose widest-reaching tweets all cover industry news, which suggests timely takes travel in that niche. It is a prompt for your own planning, not a formula.
One best post does not represent an account's typical performance.
Impressions or engagement: which matters more against a rival on Twitter?
Neither wins outright, because the two numbers answer different questions. Impressions describe display volume. Engagement describes recorded interactions. Pick the one that matches the question you were asked.
A simple split works for most reviews:
- For awareness, start with impressions and inspect the posts generating exposure.
- For discussion or sharing, start with the engagement figures and the responses themselves.
- For overall effectiveness, read both before judging.
The combination is where the insight sits. A rival with higher impressions and weaker interaction is being shown widely to people who do not respond. That pattern raises a question about topic or audience fit, and it is a different problem from low visibility.
In the benchmark report, the engagement rate is total engagement divided by total impressions, so the two measures are tied together by design. A visibility gap and an interaction gap can then be told apart in one report.
For the wider list beyond these two, see Circleboom's post on key Twitter performance metrics to track.
What a confirmed impressions gap on X points to
A gap that survives the fairness checks points to one of two places: the category or your own account. The benchmark tells you which.
If the same months dipped for every account in the set, the movement belongs to the category. If only your column dipped, the cause is closer to home, and Circleboom's post on why tweet impressions suddenly dropped covers that single-account case.
When rivals hold a steady per-post lead, timing is the first lever worth testing, because it costs nothing to change. Circleboom's best time to post on X view shows when your own followers are active.
Keep expectations honest. The report describes observed behavior on a dated sample. It shows relationships between accounts, and it does not prove that one tactic caused a result.
A fair-comparison checklist before you quote a number
A Twitter impressions benchmark is only as fair as its setup. Before a figure leaves your screen, run these five checks:
- Confirm every account in the set is a direct peer, public and under 3,000,000 followers.
- Quote the run date beside the figure.
- Say whether the number is a monthly total or an average per tweet.
- Open the Top 5 Tweets by Impressions panel and rule out a single outlier post.
- Keep the same accounts in the next run so the series stays comparable.
Each check takes a minute, and together they turn a number into evidence. A figure with a date, a basis and a named peer set is one a colleague can check without calling you.
→ Start a fair Twitter impressions benchmark
What people ask about comparing impressions on X
Where do I see my own impressions post by post?
Your own post-level impressions live in your post analytics, not in the competitor report. Circleboom's Twitter Impression Analytics shows impressions for your own tweets on X, which is the place to find the posts behind a weak month the benchmark pointed out.
Why does an account with fewer followers get more impressions than mine?
Impressions follow distribution more than follower count. A smaller account that posts when its audience is active, and whose followers are active enough to respond, can be displayed more often than a larger and quieter one. In Circleboom's benchmark for X accounts, timing and audience quality are the first levers to check for that gap.
What is a good number of impressions per tweet?
There is no single good number, and the X pages cited in this article define impressions without setting a target. The honest answer I give is relative: a good figure is one at or above the average per tweet of your direct peers, measured on the same date and basis.
Can I benchmark a private account?
No. Only public X accounts can be analyzed, and that applies to every slot in the comparison. An account with more than 3,000,000 followers cannot be added either.
How long does a monthly benchmark schedule keep running?
A monthly schedule in Circleboom's X Competitor Benchmark Report runs for the number of months you select, with one report each month on the day you chose. You can stop it at any time with End Scheduling, and the earlier dated runs stay under Past Analyses.