

Across the dozens of audience-management engagements I have run for X-heavy accounts in the last three years, the same gap has shown up in every single one: the operator can describe their audience qualitatively in five words ("US tech professionals, mostly developers") but cannot produce a single number when asked about the actual language split, geographic distribution, or interest concentration. The qualitative description is almost always wrong in at least one dimension, and the wrongness is usually load-bearing for the content strategy.
The reason the gap persists is that X's native interface surfaces almost no aggregate demographic data. The platform shows individual follower profiles, but no rollup view of language, gender, country, time zone, or interest distribution.
The full demographic audit requires pulling the data, computing the aggregates, and rendering them in a form an operator can read. That is the workflow this article walks through, and it is the read that closes the gap between what you think you know about your audience and what is actually there.
A complete Twitter follower demographics breakdown covers language, gender, country/time zone, interests, and engagement-availability windows. The Circleboom report compiles all five into one view through the official X Enterprise APIs, so the aggregates are consistent and the cross-dimension reads (language × country, interests × time zone) are possible from the same data.
The output is a single demographic report that replaces the qualitative description with measured numbers.
→ Run the demographics audit
What "Complete" Means for a Follower Demographics Read
A complete demographic read covers five dimensions, and each one answers a different question about audience composition. Skipping any of the five usually means making a content decision against a missing dimension.
Language tells you what your audience reads. An account that posts in English to a 40% non-English audience is leaving half its reach unrealized. Gender tells you who your audience is in the gendered framing relevant to advertising and brand voice. Country and time zone tell you when your audience is online and what cultural references will land.
Interests tell you what other topics your audience cares about, which is the input for related-content planning. Engagement-availability windows tell you when your audience is actually reading, which is the input for posting schedule.
Circleboom's piece on the best way to view the location of Twitter followers covers the geographic-dimension workflow specifically. The piece is useful because it walks through why platform-native location data is unreliable and what the workflow has to do to produce a defensible country-and-time-zone read.
How the Five Dimensions Interlock
The five dimensions are not independent. Language and country correlate strongly. Time zone and engagement-availability windows correlate by definition. Interests and gender correlate weakly but in patterns specific to each account.
The interlock matters because the high-value reads come from the cross-dimension comparisons rather than the single-dimension distributions. "30% Spanish-speaking" is one read. "30% Spanish-speaking and concentrated in Mexico City and Buenos Aires time zones" is a different read that changes the posting-schedule decision. "30% Spanish-speaking, concentrated in those two time zones, and over-indexed on the fintech interest cluster" is a third read that changes the content-topic decision.
The aggregate dashboard is the surface that makes the cross-dimension reads possible. Single-dimension exports lose the joint distribution, which is where most of the actionable signal lives. Datareportal's global social-media-user reports is useful background because the platform-wide demographic distributions provide the benchmark against which your account-specific reads acquire meaning.
How to Run the Demographics Audit Step by Step
The workflow runs in two phases: the data pull, then the cross-dimension read. The first run takes 15 to 25 minutes; subsequent runs are faster because the dashboard configuration is saved.
Phase 1: The Data Pull
Log in to Circleboom Twitter
- Log in to Circleboom Twitter with the X account you want to audit. Login uses official OAuth, so credentials never pass through Circleboom directly.

Open the Follower-Following menu
- Open the Follower-Following menu in the left navigation. The audience-analytics surface holds the demographic reports.
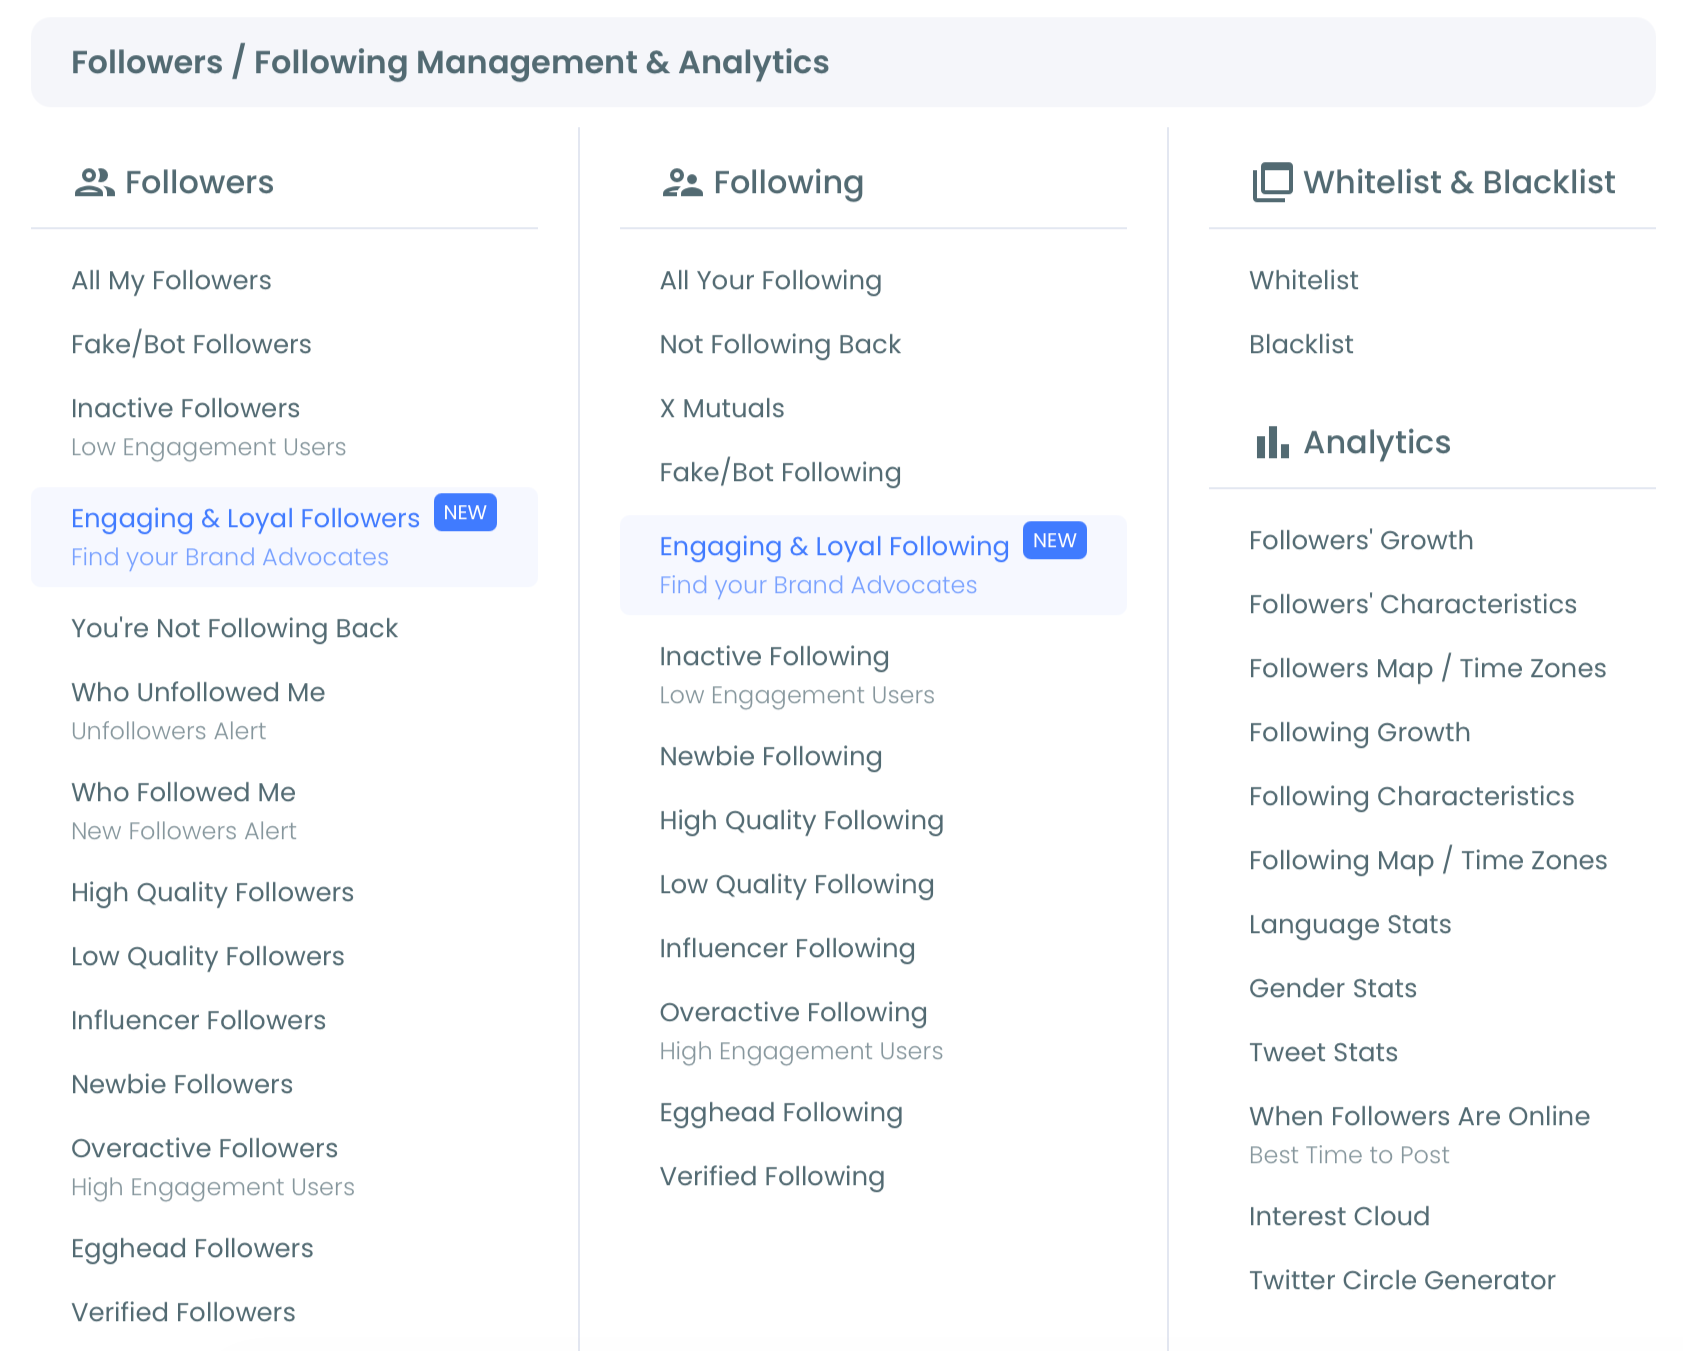
Open the Follower Demographics dashboard
- Open the Follower Demographics dashboard. The dashboard pulls the latest data from the connected X account and renders the five-dimension view: language, gender, country/time zone, interests, and engagement-availability windows.
Phase 2: The Cross-Dimension Read
Read each dimension independently first
- Read each of the five dimensions independently to establish the single-axis distributions. Note the top three values for each dimension and any unexpected concentrations. The independent reads are the baseline against which the cross-dimension reads acquire meaning.
Run the high-value cross-dimension comparisons
- Run the cross-dimension comparisons that map to your content decisions. The high-value pairs are language × country (translation/localization planning), time zone × engagement window (posting schedule), and interests × gender (content-topic and brand-voice decisions).
Capture the cross-dimension reads as a content-strategy input
- Capture the cross-dimension reads in your content-strategy document. The single-dimension distributions become the demographic profile. The cross-dimension reads become the content-decision inputs for the next planning cycle.
The six-step sequence is the full workflow. The OAuth login earns sanctioned API access. The menu navigation loads the analytics surface. The dashboard pull produces the data; the independent reads establish the baseline; the cross-dimension reads produce the content-strategy inputs.
Video walkthrough: the demographics dashboard with all five dimensions visible and the cross-dimension reads demonstrated.
What the Audit Produces and Why It Holds
The output is a five-dimension demographic profile, a set of cross-dimension reads, and a saved dashboard configuration that produces the next quarter's update on a single click. The qualitative description ("US tech professionals, mostly developers") is replaced by the measured profile that confirms or refutes each piece of the description.
The Circleboom workflow uses official X Enterprise Developer access for the data pull, which is why the demographic aggregates stay accurate over time.
Pew Research's data on X usage patterns provides the platform-wide benchmarks that frame the account-specific reads, particularly on the language and country dimensions where the platform-wide distribution is heavily skewed.
Two adjacent surfaces extend the workflow. The gender on Twitter landing covers the gender-dimension drilldown specifically. The Twitter language stats landing covers the language-dimension drilldown for accounts with multilingual audiences.
Related Circleboom reading on the demographic-audit theme.
- How to check interests on Twitter on the interest-dimension audit specifically.
- How can I find people with the same interests as me on X on the interest-cluster discovery side of the workflow.
- How can you identify the most common languages among your Twitter followers on the language-dimension drilldown.
Why the Audit Holds Once You Run It
The reason the demographic audit holds where qualitative descriptions drift is that the measured numbers do not move on their own. The dashboard rebuilds against the current follower list at each pull, so the audit produces a quarterly snapshot that can be compared against the prior quarter to read demographic drift.
The compounding benefit is structural. The first audit replaces the qualitative description with measured numbers. The second audit shows which dimensions are stable and which are shifting. By the fourth quarterly audit, the demographic trajectory is legible across a year, which is the time horizon over which the content strategy compounds against the audience. Run the demographics audit and the audience description becomes a measurement rather than a guess.
Still Wondering?
How often should I run the demographics audit?
Quarterly is the natural cadence for most accounts. Demographic distributions are stable enough that monthly audits surface mostly noise, but follower growth and audience drift over a quarter are usually large enough to produce meaningful change in at least one dimension. Quarterly aligns well with content-planning cycles for most operators.
Can the audit show me how a specific post changed the demographic profile?
Not directly, because the audit measures the cumulative follower list rather than per-post follower acquisition. For per-post acquisition reads, pair the demographic audit with the post-engagement analytics surface, and the joint read shows which posts changed which dimension.
What if my audience size is too small for the percentages to be reliable?
For follower counts under 500, single-dimension distributions become noisy and cross-dimension reads become unreliable. The audit still runs, but operators with smaller audiences are usually better served by reading the top 5 to 10 individual follower profiles rather than the aggregate distributions until the audience size supports the aggregates.
Does the audit work for multiple X accounts in the same workspace?
Yes. Each connected account has its own demographic dashboard, and the cross-account comparison is its own useful read for operators managing several accounts in the same niche. The audit configuration carries across accounts.
How does the audit handle followers who hide their location or language?
Followers without declared location or language are surfaced as an "unknown" category rather than being dropped from the aggregates. The unknown percentage is itself a useful signal: high unknowns usually indicate a heavily privacy-conscious audience or a high bot-account percentage, both of which inform downstream audits.