
To compare Twitter accounts' analytics fairly, measure every X account per tweet, per impression and per active follower, all pulled on the same date. Raw totals reward size and posting volume, so a 9,000-follower account can look weak next to a 120,000-follower account even when its posts work better.
Three divisions that make big and small accounts comparable.
• Divide engagements by the number of tweets, so posting volume stops passing for performance.
• Divide engagements by impressions, the engagement rate X itself defines.
• Replace follower count with active, human followers before you judge audience size.
Circleboom compares up to five X accounts on exactly those terms in one dated report, with Enterprise-grade access to X's official API behind every figure. Compare Twitter accounts' analytics on one basis.
Why raw totals mislead in a Twitter analytics comparison
Raw totals mislead anyone who tries to compare Twitter accounts' analytics, because every one of them grows with account size and posting volume, not with how well the posts work.
Follower count is cumulative and never corrects itself, so the oldest, largest accounts carry the most dormant and fake followers.
Total engagements have the same flaw. An account that posts six times a day collects more likes in a month than one that posts once, even if each of its tweets does worse.
Most people start from a profile page or a single-account dashboard. Reading Twitter analytics for another account shows you that one account, but nothing in it tells you whether its numbers are big for its size. The free Twitter X Metrics Calculator has the same limit: one public account at a time.
A comparison is only fair when every account goes through the same arithmetic first.
Circleboom calculates per-tweet averages, impression-based engagement rates and active-follower shares for each X account in a report, from the same official X API records. With it you can compare Twitter accounts analytics side by side instead of lining up screenshots taken on different days.
Four ways to normalize X account analytics before you compare
Each normalization removes one unfair advantage: posting volume, distribution, a padded audience and timing. The worked example below follows two accounts through all four.
The two accounts:
- Account A: 120,000 followers, posting about six times a day.
- Account B: 9,000 followers, posting about once a day.
Per-tweet averages remove the posting-volume advantage
When you compare Twitter accounts' analytics, divide each account's engagements by the number of tweets that earned them.
Over 90 days, Account A publishes 540 tweets and collects 27,000 engagements, which is 50 per tweet. Account B publishes 90 tweets and collects 5,400, which is 60 per tweet.
On totals, A is five times ahead. Per tweet, B is ahead.
That reversal is why Circleboom's Engagement table works per post. Every interaction column, from average likes and reposts to replies, quotes and bookmarks, is a per-tweet average; the period totals live in separate month-by-month charts.
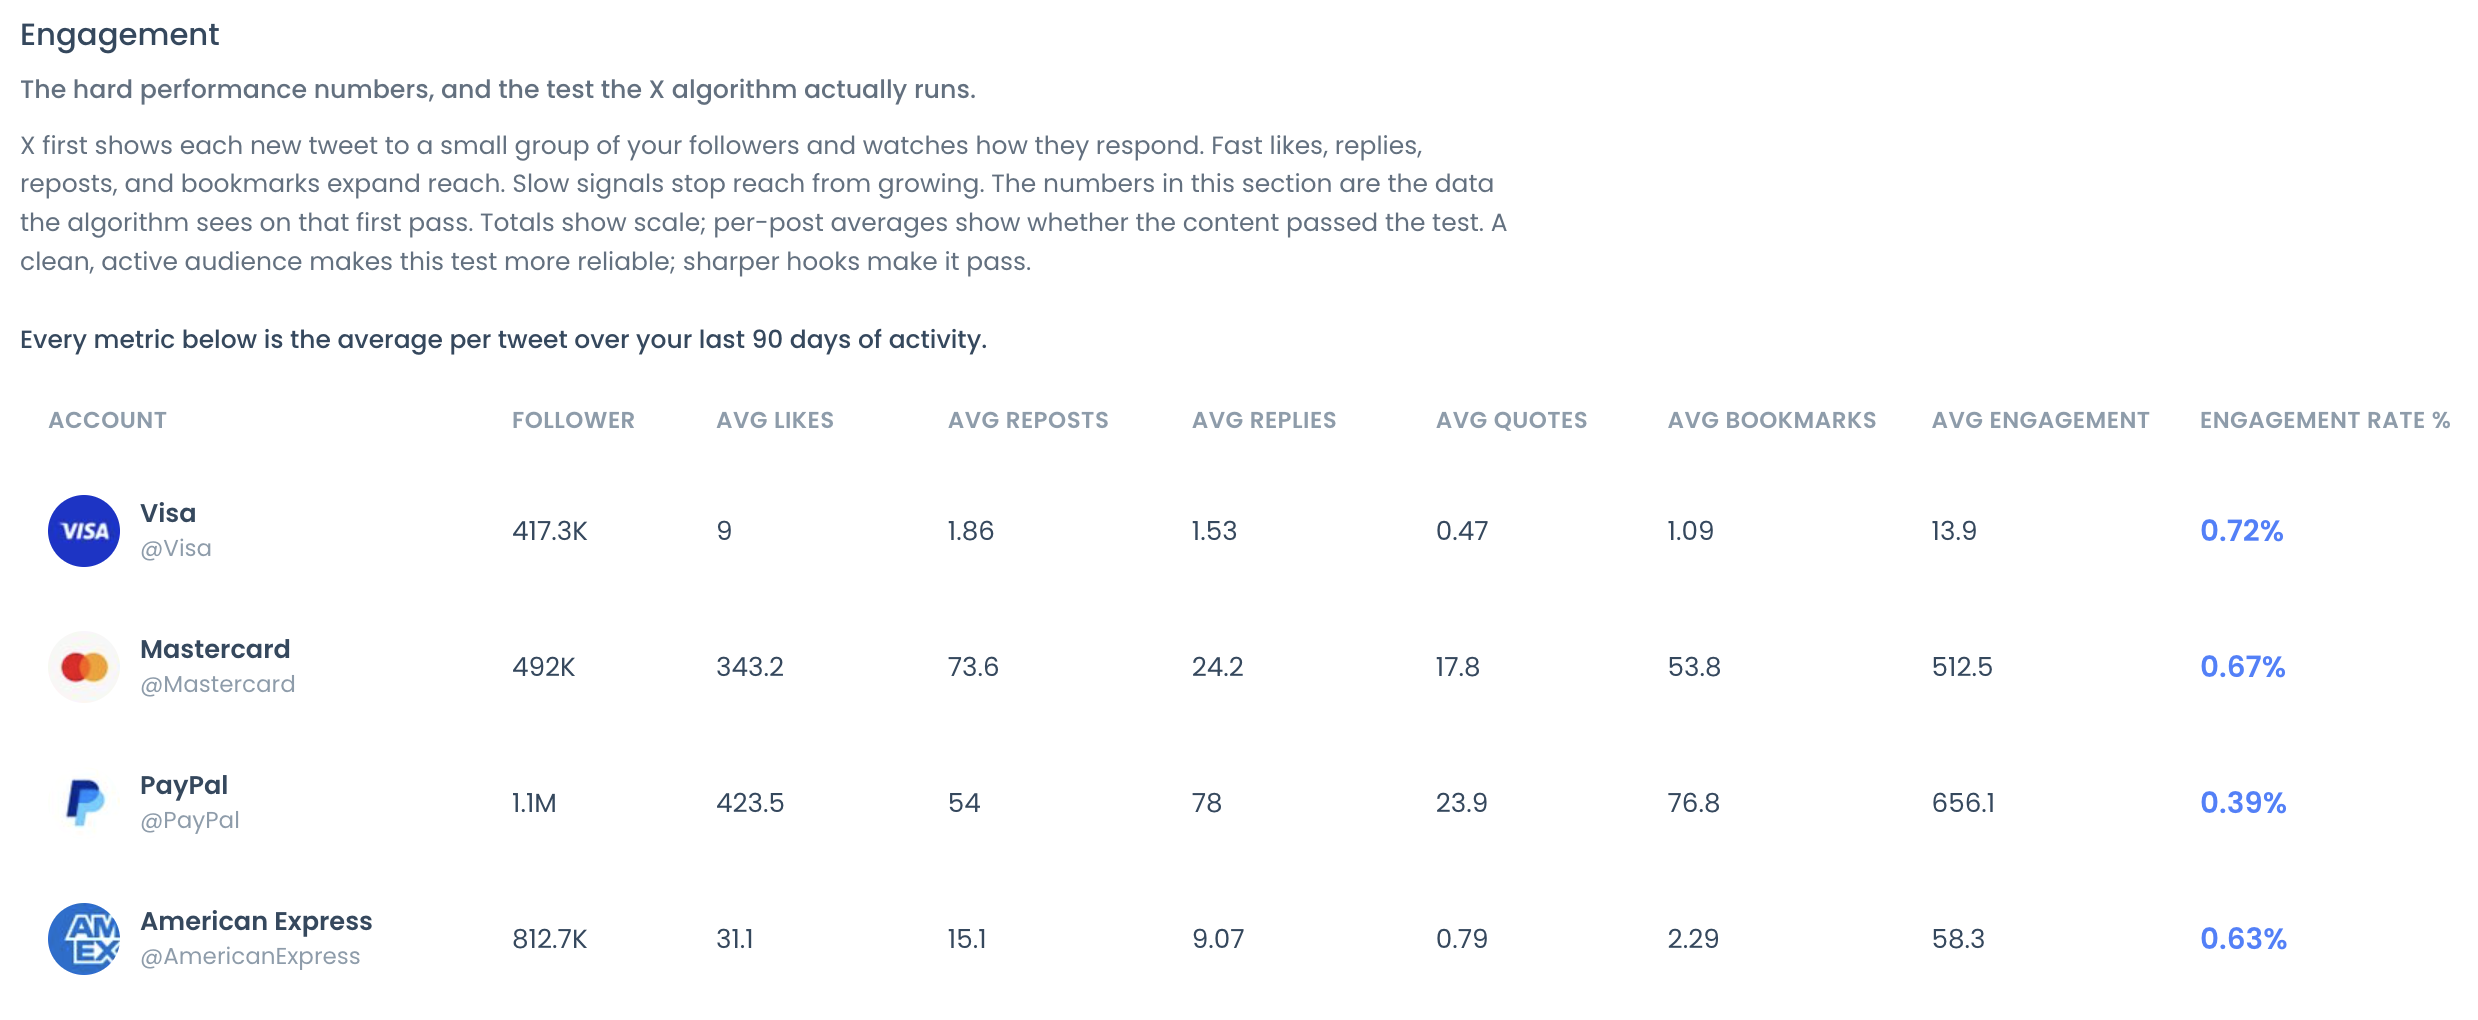
Read the table first and the monthly charts second. A rival ahead on monthly totals but level per tweet is ahead on volume, and a volume gap costs a very different amount to close than a content gap.
If a column name is unfamiliar, the explainer on tweet activity and Twitter analytics metrics defines the basics.
Engagement rate on impressions removes the distribution advantage
Per-tweet averages still favor the account whose posts are shown to more people. Dividing engagements by impressions fixes that.
If A's tweets average 6,000 impressions, its 50 engagements per tweet is a 0.83% engagement rate. If B's average 2,000, its 60 per tweet is 3.0%.
B's posts turn attention into a response more than three times as often.
Active followers remove the padded-audience advantage
Follower count says how big a list is, not how many people on it still post. Use the active-follower share instead.
At 35% active, A's 120,000 followers hold 42,000 active accounts; at 70% active, B's 9,000 hold 6,300. A 13-to-1 size gap shrinks to under 7-to-1.
In a sample report run on public accounts, the account with the largest list, 1.1 million followers, also carried the highest suspected bot share at 34% and produced the smallest high-quality tier, 2%. Two smaller accounts in the same set reached 16% and 17%.
The biggest list had the weakest core.
Treat these classifications as signals to review, not verdicts. An account that rarely posts may still read everything.
The same date window removes the timing advantage
Circleboom pulls every account in a report on one run date, with up to about 3,200 recent tweets each. That keeps audience snapshots aligned.
But the tweet samples still cover different stretches of time. At six tweets a day, A's 3,200 tweets span roughly 18 months; at one a day, B's would span almost nine years.
So check post dates before you compare averages, and use the monthly charts when you need the same calendar months side by side.
Account age needs the same care. A nine-year-old account with 120,000 followers grew about 1,111 a month; an 18-month-old account with 9,000 grew 500 a month.
Growth per month, not the current total, is the fair read.
The two accounts after all four normalizations
Put the worked example in one table and the verdict flips back and forth depending on the measure:
| Measure | Account A | Account B | Leader |
|---|---|---|---|
| Engagements in 90 days | 27,000 | 5,400 | A |
| Engagements per tweet | 50 | 60 | B |
| Engagement rate on impressions | 0.83% | 3.0% | B |
| Active followers | 42,000 | 6,300 | A |
| Engagements per tweet per 1,000 followers | 0.42 | 6.7 | B |
A wins only on the two rows that measure size. B wins every row that measures how well a single tweet works, which is the question most comparisons are really asking.
That split is the useful finding. A's team should not copy B's cadence, and B's team should not chase A's follower count; each account has a different gap to close.
Is engagement rate based on followers or impressions?
Engagement rate in Circleboom's report is total engagement divided by total impressions, not by followers. X uses the same basis: its own dashboard help page defines engagement rate as engagements divided by impressions.
Some tools divide by followers instead. That version answers a different question: how much response each member of the audience gives.
Work it out by hand from the report: A's 50 engagements per tweet on 120,000 followers is 0.42 per 1,000 followers; B's 60 on 9,000 is 6.7 per 1,000.
Quote the basis every time you quote a rate. A follower-based 6.7 and an impression-based 3.0% describe the same account, and mixing them in one slide starts an argument nobody can settle.
There is a second reason your own dashboard may disagree with a benchmark. X's API documentation marks likes, reposts, replies, quotes, bookmarks and impressions as public metrics, while link clicks, profile clicks and X's own engagements count are private to the post's owner.
A fair benchmark can only use fields that exist for every account. Circleboom's total engagement adds likes, reposts, replies, quotes and bookmarks, and owner-only metrics such as link clicks and profile visits do not appear in any column, including yours.
For a single tweet, the tweet engagement rate calculator runs the same division.
Which X accounts make a fair comparison set?
To compare Twitter accounts' analytics fairly, build the set from direct peers: accounts that share your target market, language, scale, publishing purpose and business model.
Industry alone is not enough. A regional support account and a global entertainment brand can sit in the same sector and still serve different goals.
Category leaders belong in a separate report. Study them for approach, but never treat their raw totals as your target, because that is how teams end up funding output they cannot sustain.
Two checks keep the set honest:
- Freeze it between runs. If you swap an account, say so, because a different group is not a change in position.
- Check the publishing purpose. In the sample report, one account ran on roughly 2% original posts, so its numbers described a support desk rather than a content program.
If you need a baseline before choosing peers, the single-account X Account Analysis Report measures your own account against its earlier runs.
How to compare Twitter accounts analytics in Circleboom
To compare Twitter accounts analytics in Circleboom, put up to five public X accounts into one X Competitor Analysis & Benchmark Report and let it calculate the same nine sections for each.
Every account is pulled on the same date, so the per-tweet tables, impression-based rates and audience-quality shares line up without manual work.
Circleboom pulls those records as an Enterprise API developer on X's customer list, so the samples come from X's own records rather than scraped fragments.
Before you start, you can open the sample competitor report to see the layout.
- Open Circleboom Twitter Management and sign in; your own X account can take the first slot or stay out of the set.

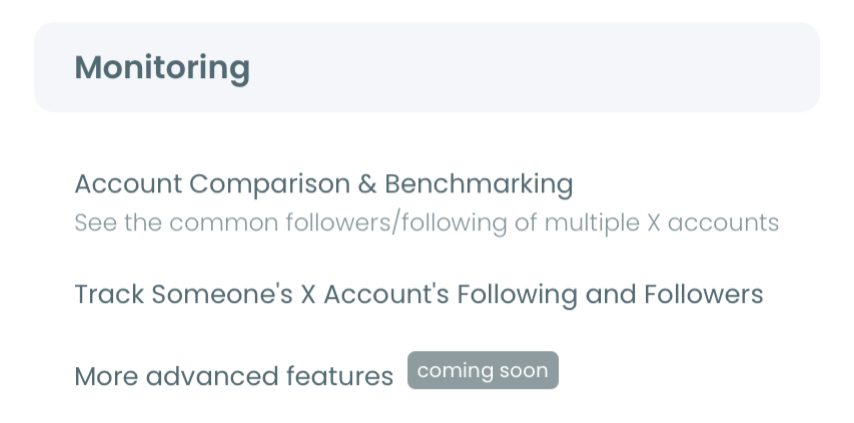
- Go to the Monitoring menu and choose X Competitor Analysis & Benchmark Report, the first item there.
- Add the handles under Account Handles, one per @ field, using the + button until the counter shows the set you planned.
- Click Start Competitor Analysis and pick Just this once, or Keep it up to date every month for today's report plus one fresh report each month.
Same accounts, same run date and the same per-post calculations are what make the differences readable. A hand-built spreadsheet changes at least one of those three, and then every gap turns into an argument about method.
In short: open Circleboom, go to Monitoring, add up to five handles, start the analysis and read the per-tweet table before the totals.
With the report in hand, you can benchmark up to five X accounts in one dated report every month without rebuilding the comparison.
What to do when audience quality explains the gap
When you compare Twitter accounts' analytics and a rival's lead disappears after you switch to active followers, the gap was never content. It was audience composition, and the next step is reviewing your own list.
Start with the shares that differ most across the set: suspected bot, inactive or low-quality tier. A gap in any of them changes the denominator of every follower-based ratio, so read it before you read follower count.
Fake profiles distort that denominator in both directions. The post on AI-made fake Twitter profiles is worth reading before you trust any follower-based ratio.
A Twitter follower audit is the practical tool for reviewing your own list, and the next dated report then shows whether your active share moved.
If you only need to know whether two accounts share followers, a full benchmark is more than you need. The Compare Twitter X Accounts tool checks the overlap between two accounts directly.
Is the comparison going to a client or a manager? The guide to creating a branded presentation from a competitor report covers the export.
Fair comparison checklist for your next X report
To compare Twitter accounts' analytics fairly in every future report, keep five habits, each of which closes a specific loophole:
- Compare per-tweet averages before monthly totals.
- State whether a rate divides by impressions or by followers.
- Read follower count only after the active and bot shares.
- Check the post dates each account's sample covers.
- Keep the peer set frozen between runs.
Fair comparisons rarely flatter the biggest account, and that is the point. The number that survives all five checks is the one worth acting on.
→ Compare Twitter accounts analytics fairly in one report
Fair X benchmark questions after your first report
Which X accounts can't be compared in the report?
Protected accounts and accounts above 3,000,000 followers can't be analyzed, and that cap applies to your own account too. One report holds up to five accounts. The full limits are in how many accounts you can compare in a competitor analysis report.
How do I see whether the gap changed since last month?
Open two dated runs of the same saved set in Circleboom and compare per-tweet averages first, monthly totals second and audience composition third. Each run is a new snapshot, so a moved average can also reflect older tweets leaving the sample.
Why doesn't the report show link clicks or profile visits on X?
Link clicks and profile visits are visible only to a post's owner on X, and the report does not include them for any account, your own included. A benchmark built only on fields every account shares keeps the comparison level.