

Rewrite your posts to the wrong length and you pay twice: once in the hours of editing, and again when the posts your audience liked stop sounding like you.
A tweet length benchmark removes the guess before you touch a draft. Below are the run, the reading and a small test that ends in a decision.
How do you compare post length across X accounts?
Add your account and up to four others to one report, then read each account's typical character range in the Average post length panel. Circleboom reads each X account's recent posts with official Enterprise APIs and reports the range it typically writes in.
→ tweet length benchmark
What goes wrong when you compare tweet length by eye
A by-eye comparison samples the wrong posts, and it samples them differently for every account.
You open a rival's profile and read the newest posts. You remember the ones that stood out. Then you judge your own account from memory, where your longest posts loom largest.
Three errors stack up:
- The posts you read are a tiny, recent slice.
- The slice covers a different period for each account.
- Your own account never gets the same treatment.
I have watched teams act on that kind of read. The usual outcome is a blanket instruction, "write shorter," handed to everyone who drafts.
A blanket instruction is expensive when the premise is wrong. Editors cut posts that were working, and nobody can say afterwards what the cut was supposed to fix.
There is a marketing cost as well. Length is part of how an account sounds. Followers who came for full explanations notice when every post turns into a slogan, and followers who came for quick takes notice the opposite.
Why a spreadsheet only half fixes it
A spreadsheet is the careful version of the same method. You can export tweets and X posts for each account and count characters yourself, but you then own the job of keeping the period and the method identical across accounts.
The faster route is to compare tweet length across accounts in one report, where the same fields are pulled for each account on the same date.
What a tweet length benchmark measures on X
A tweet length benchmark measures the typical character range each account writes in, shown side by side for the whole set.
In Circleboom, that lives in the X Competitor Benchmark Report. The report has a Posting Behavior section, and one of its panels is Average post length.
Each account gets one horizontal bar with a sentence printed on it, for example "Typically posts between 16 and 610 characters."
Two details shape how you use it:
- The panel prints a range, not a single average figure.
- Bar length is read against a character-count axis and marks the typical post.
The range describes how an account works. It does not grade the writing. When the two numbers sit far apart, the account is mixing very short posts with long ones.
X's own overview of the different types of posts describes the kinds of posts an account can publish. The benchmark shows how much of the available space each account uses across the posts in its sample.
Some ranges will run past the standard post length. That is possible on accounts with a higher allowance, and if you want that option yourself, here is how to make longer tweets.
How to place your range against the others
Read the two ends of your label against the two ends of each rival's label. You will land in one of three positions.
Your range can sit above theirs, with a higher low end and a higher high end. You write longer across the board.
Your range can sit below theirs. You write shorter across the board.
Or your range can sit inside theirs, narrower at both ends. That position is easy to misread.
You are not longer or shorter. You use fewer lengths than they do, and the fix is variety, not trimming.
When two labels are close at both ends, length does not separate the accounts. That result is useful too, because it tells you to stop adjusting length.
Where the benchmark data comes from
Source matters for a measurement you plan to act on. Circleboom is one of the companies on X's official Enterprise developers list, and the report retrieves up to about 3,200 recent tweets per account through X's API.
That gives every account the same basis. It also means the window is recent activity, not an account's full history.
With that in place, a tweet length benchmark is something you can explain to a client or a manager line by line.
How to run a tweet length benchmark across X accounts
The run has eight steps in four phases, and the phases follow the screens in order.
Log in and open the benchmark report
- Log in to Circleboom Twitter and get your own X account connected before anything else.

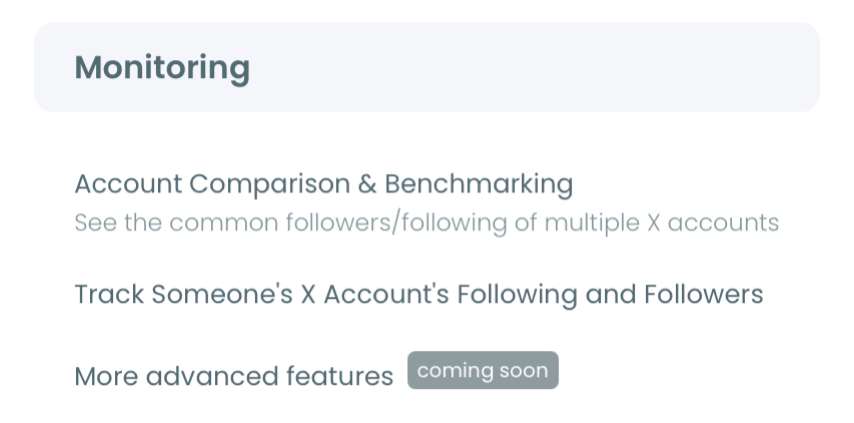
- Go to the Monitoring menu and select X Competitor Benchmark Report, the first item in the menu.
Add the accounts you want to compare
- Enter one handle per @ field in the Account Handles section. Use the + button to add a slot, up to five accounts in total.
- Confirm every account qualifies. A private account cannot be analyzed, and neither can one with more than 3,000,000 followers.
Start the analysis and set its schedule
- Click Start Competitor Analysis. The cost appears in Competitor Tokens, charged per competitor per report, and your own account does not use one.
- Select Just this once or Keep it up to date every month. The monthly option adds a MONTHS selector and a FIRST MONTHLY REPORT ON selector for the day of the month.
Open the report and find the length panel
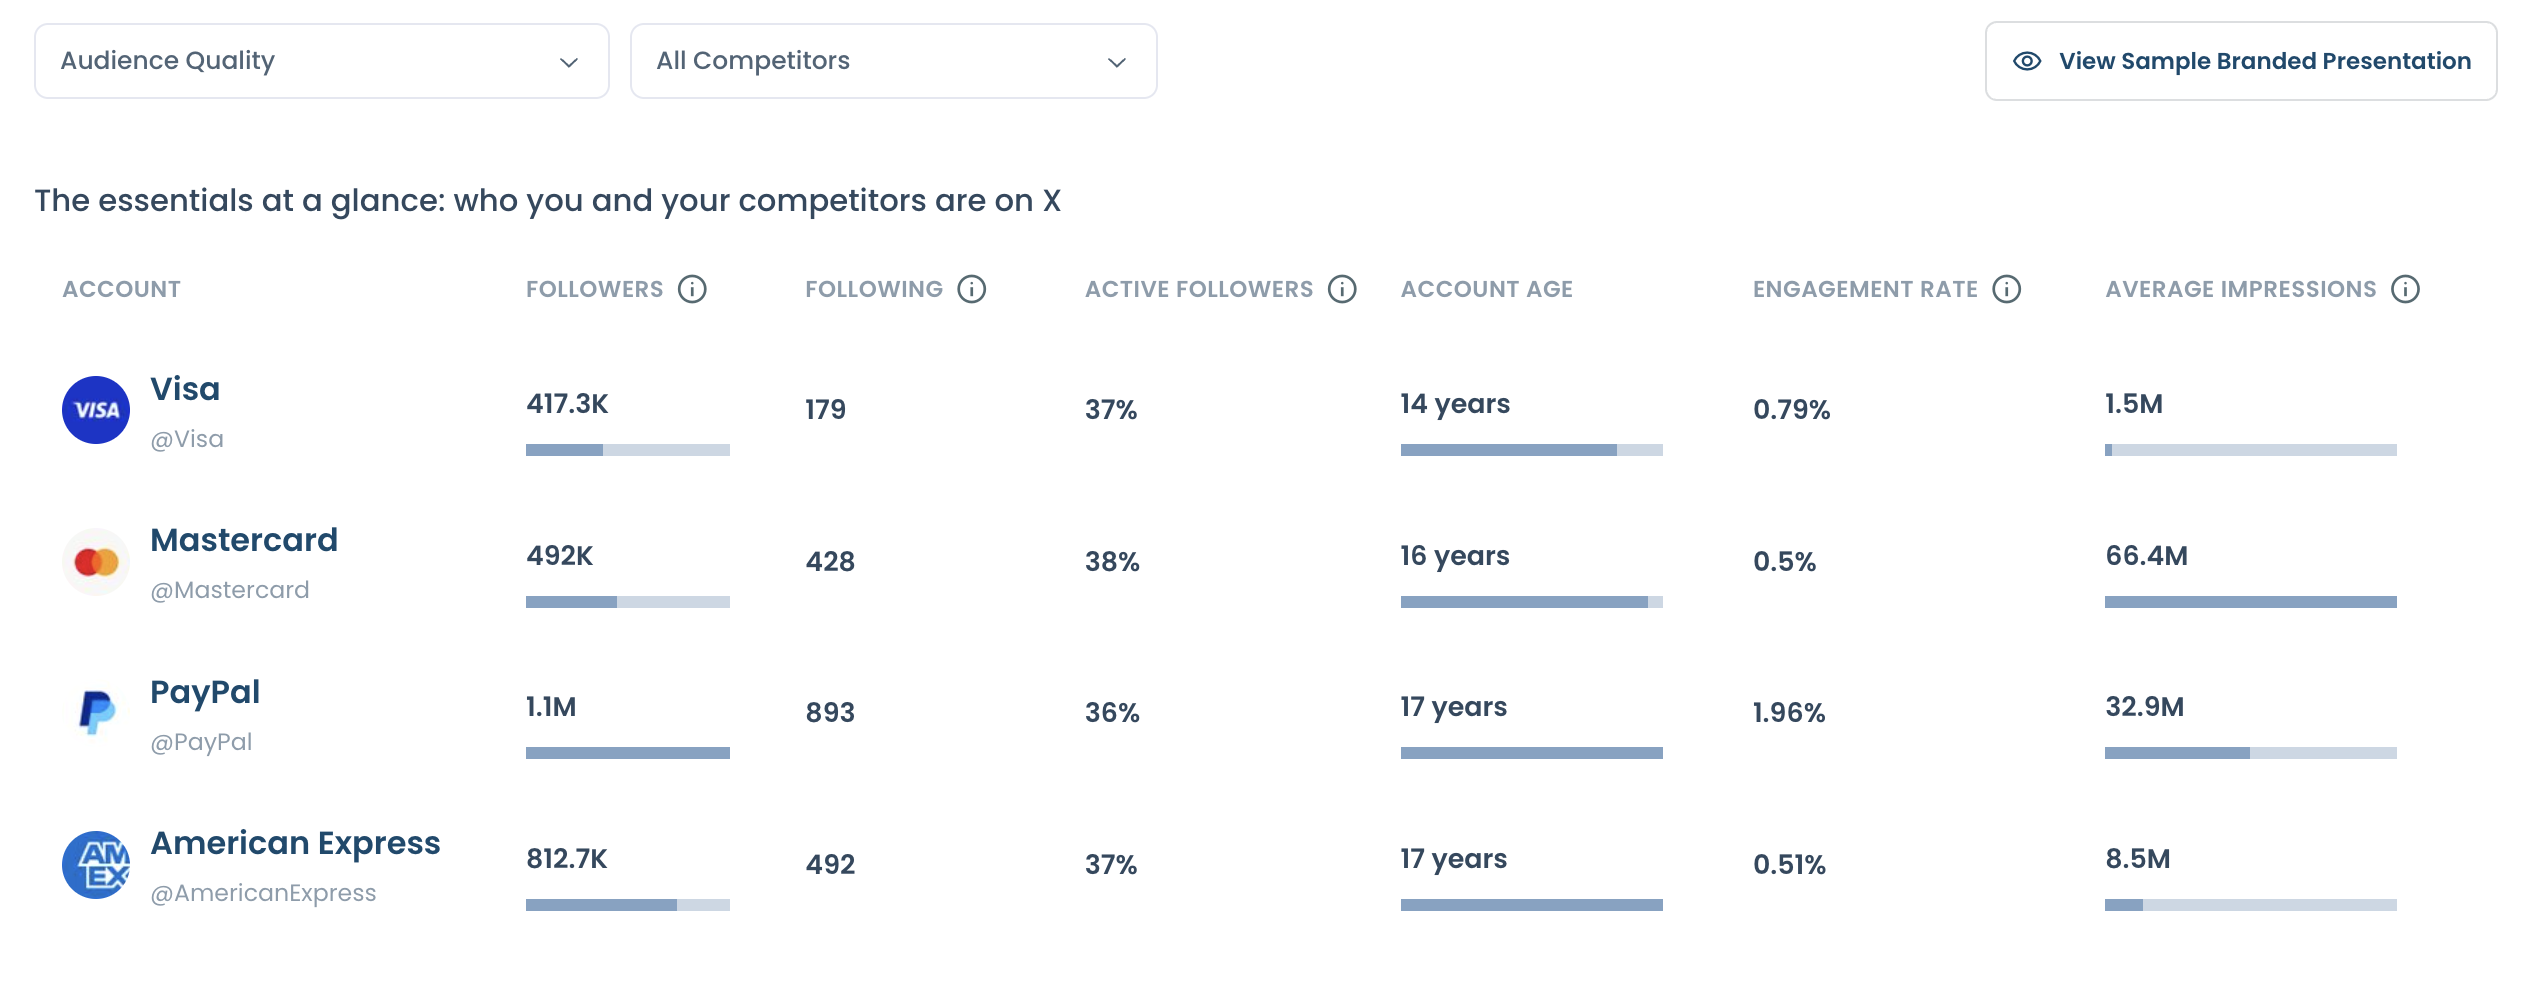
- Click View report on the saved analysis card. The report opens on the essentials table, which lists each account's followers, following, active followers, account age, engagement rate and average impressions.
- Scroll to Posting Behavior and read the Average post length panel. Note the low number and the high number in every account's label.
This sequence works because the account set is fixed before any data is pulled, so every range in the panel rests on one run and one date. Choosing the schedule at the start also means the next comparison uses the same set without anyone rebuilding it.
The run in four lines:
- Log in and open Monitoring.
- Add up to five public accounts.
- Start the analysis and choose once or monthly.
- Open the report and note each length range.
Now you have the ranges. The next job is deciding what they ask you to do.
Worked example: a rival at 40 to 120 characters against your 200 to 280
This scenario is illustrative, and it follows the growth tip documented for the panel.
Say a rival's label reads "Typically posts between 40 and 120 characters." Yours reads between 200 and 280. Their engagement in the same report looks strong.
The ranges do not overlap at all. Your shortest typical post is longer than their longest.
It is tempting to conclude that short wins. The panel does not support that. It describes length, and nothing in it links length to response.
What the gap does give you is a clean question: would your audience respond to a shorter version of what you already write?
A length gap is a reason to run a small test, not a reason to change everything you publish.
How to size the test
Keep the test narrow enough that you can read the result:
- Pick a few posts, not a month of them.
- Change one thing, the length, and keep the topic and the point.
- Publish the short versions the way you normally publish.
- Decide beforehand which measure you will read.
Choosing the measure first matters. If you care about replies, read replies. If you care about how often people who saw the post reacted, read engagement rate.
When to stop the test
Stop after one round, and decide by this rule: if the shorter versions do not do better than your usual posts on the measure you chose, length was not your gap.
In that case, return to your normal length and look at another section of the report, such as timing or format.
If the shorter versions do better, keep a short mode in your mix. That is all the result licenses. It does not say every post should be short.
The rule exists because length tests have no natural end. Without a stopping point, a team keeps trimming, and the account's voice drifts with each round.
How to turn long X posts into shorter versions for the test
The quickest way to produce the short versions is to rewrite posts you have already published.
Circleboom's AI Writer has a style called Minimalist (One-Liner). Its output is one sentence that carries the idea in the most concise form possible, which is exactly the shape the test needs.
You can start from an existing post with AI rewrite for old tweets, which opens a revised draft in the composer for you to edit.
Full tutorial: AI Writer generating X posts in your own voice, the tool this test uses for its shorter versions.
Check each rewrite before it goes out:
- The one-liner still makes the original point.
- It sounds like the account, not like a template.
- It fits the character allowance of the connected account.
No rewrite goes out on its own. You choose Queue Up Next, Post Now or Schedule for each one.
If AI drafting is new to your workflow, this piece covers why you should use an AI tweet generator.
Running the test toward longer posts
The test can also run the other way. When your range sits below a rival's, write a few fuller posts and keep each one to a single argument.
The same checks apply in reverse. The longer version should add something the short one lacked, such as the reason behind a claim or the example that proves it. Extra words with no extra point only make the post slower to read.
For quick drafts, the AI Tweet Generator is another starting point.
How do you check which of your tweet lengths worked?
You check it in your own post results, because the competitor report describes rivals and cannot score your experiment.
Circleboom's tweet engagement analytics view, named Post Engagement Analytics in the app, lists your posts in a table, one row per post, with a column for each metric.
For a length test, three moves are enough:
- Filter by date range so only the test period is visible.
- Find the short versions and your usual posts from the same period.
- Read the measure you chose for both groups.
Compare the test posts with your own account's normal level, not with a general benchmark from elsewhere.
Watch the sample size. A post with very few impressions can show a high engagement rate from a handful of reactions, and that proves little.
The goal is narrow: did the other length do better for you, yes or no?
What the next benchmark run shows
The competitor report gives you a second reading later. Each run is saved with its date, and earlier runs for the same account set stay under Past Analyses.
If you kept a short mode after the test, the low end of your own label should move down in a later run. Because every run uses a fresh sample of recent posts, read a moved number with care. New posts enter the sample and older ones leave it, so confirm the change against what you published.
What a wrong length guess costs, and what the benchmark costs
Without a comparison, a length decision is a guess, and the guess gets applied to every post you publish.
With one, the decision shrinks to a few test posts and a rule for stopping.
The mistake I see most often is skipping the middle. A team sees a rival's short posts, skips the measurement, skips the test and rewrites its whole calendar. Weeks later nobody can tell whether the change helped.
The alternative is small. One report gives you the ranges. A few rewritten posts give you evidence from your own audience. One round tells you whether to keep going.
If the ranges match, you have learned that length is not the issue, and you have saved the rewrite entirely.
→ Start your tweet length benchmark
Still wondering whether to write shorter or longer?
Is a thread better than one long post on X?
Neither is better by default, and the benchmark cannot settle it, because the report has no thread usage rate. A thread works on any account, while one long post needs an account with a higher character allowance. If that second route interests you, see how to tweet more than 280 characters on Twitter.
Is there a report for my own posting profile with no rivals?
Yes. Circleboom's Account Analysis Report covers a single account on its own, and it sits under Followers / Following Management and Analytics, in the Analytics group. Use the competitor report when you want to compare with named accounts, and the single-account report when you only want your own picture.
Can the comparison refresh itself every month?
Yes. Choose Keep it up to date every month when you start the analysis, then set the number of months and the day of the month. Each scheduled run is saved as a new dated report, and End Scheduling stops it at any time.
Can I share the length chart with a client or my team?
Yes. Starting from the current report, Create Branded Presentation produces an export that carries a logo. Keep the account set and the run date visible in the deck so readers know which posts the ranges describe.

