What actually belongs inside each box of a SWOT analysis on Twitter? A quadrant is finished when it names an X data point you can pull today, and naming that data point is the step almost every template skips.
What each quadrant gets filled from.Strengths: the followers you share with a rival, weighted by engagement band.Weaknesses: everyone on that rival's list who is missing from yours, which is the audience you have never reached.Opportunities: the handful of names that recur across the following lists of two or three category leaders.Threats: every follow and unfollow a rival makes while you are watching, each stamped with its date.
Circleboom computes those intersections across two public X accounts, tagging every name it returns with an activity band, a follow ratio, and an account age. That is where a SWOT analysis on Twitter begins.
What a SWOT analysis on Twitter actually refers to
The phrase covers two different exercises, and search results mostly serve the wrong one.
The first is a corporate SWOT of X as a company: real-time reach as a strength, advertiser volatility as a threat. Useful in a business-school case, useless if you manage an account.
The second is a SWOT of your own presence on X, benchmarked against the accounts you compete with for the same attention. That is the one people are usually looking for, and it is the one this article covers.
The reason the second version is harder is sourcing. Your own analytics tab describes one account, and a strategic position exists between accounts. An X competitor analysis has to read two profiles at once before it produces anything a colleague cannot dispute.
Circleboom pulls the follower and following lists of two public X accounts and computes their intersection, which is the relational reading a single-account dashboard cannot produce.
Most walkthroughs of how to analyze a competitor's Twitter account stop at "look at their top posts," which fills zero quadrants with anything countable.
The four quadrants mapped to X data you can pull
Each quadrant gets one primary number and one source. Nothing goes in a box unless it can be re-pulled next quarter.
| Quadrant | Question it answers | Data that proves it |
|---|---|---|
| Strengths | Who already chose me? | Shared-follower count with a rival, filtered to the Active / High Engagement band |
| Weaknesses | How much of the market is out of reach? | Rival's follower total minus the shared count, plus your own inactive share |
| Opportunities | Who does the niche already trust? | Accounts common to the following lists of two or three leaders |
| Threats | What moved without my input? | Dated follow and unfollow events on a rival account |
The top two rows come from one run. Line your handle up against a competitor's in followers mode and the tool returns the middle of the Venn diagram, which is the strengths evidence; what falls outside it on their side is the weaknesses evidence.
One comparison, two quadrants
Worked example, using round numbers: a competitor with 12,000 followers who shares 1,800 with you leaves about 10,200 accounts in your category that have never encountered your posts. That is a weakness with a headcount, which behaves very differently in a planning meeting than "low awareness."
Engagement quality decides whether the same 1,800 is a strength at all. Circleboom classifies every account in the results grid as Active / High Engagement, Moderate Active / Medium Engagement, or Inactive / Low Engagement, so an overlap made of dormant profiles gets read correctly instead of flattering you.
For the internal side of the grid, X's own advertising glossary defines engagement rate as engagements divided by impressions. That ratio belongs in the strengths box next to the overlap figure, because one describes how many of the right people you hold and the other describes how hard they work.
A wider read on Twitter metrics helps you decide which secondary numbers earn a line and which are decoration.
Is a SWOT analysis on Twitter worth repeating every quarter?
Yes, but only the top half needs a full re-run. Strengths and weaknesses are snapshot questions, so they change slowly and re-reading them quarterly is enough.
The other two boxes are about motion rather than position. They describe what is changing, and one reading of a list cannot show change however fresh that reading happens to be.
A rival's founder following four recruiters in one week is a threat signal precisely because it is a change, and a single-point measurement cannot see change.
That split is why so many social SWOT documents feel stale a month after they are written. The bottom two boxes were filled from a snapshot that could never have answered them.
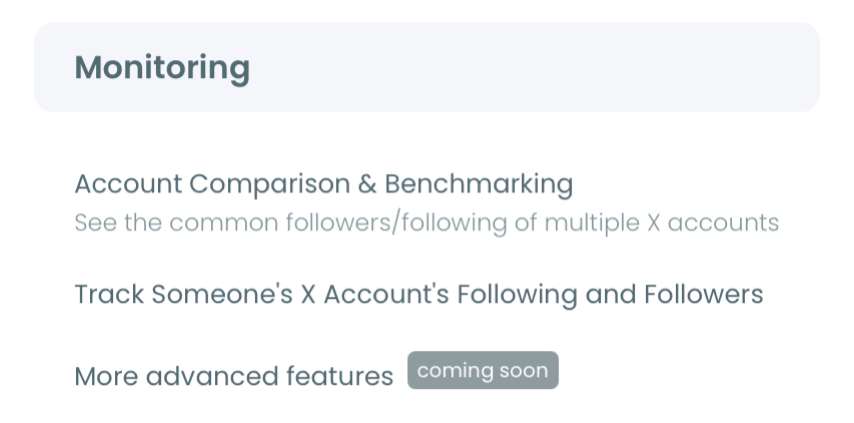
Circleboom separates the two instruments inside the same Monitoring menu, which is what makes a repeatable SWOT analysis on Twitter practical rather than an annual chore. Account Comparison produces the snapshot. Track Someone's X Account produces the delta, recording a target's follower and following lists on a schedule and charting additions and removals by day.
Finding the intersection of followers between two Twitter accounts is the snapshot job. Watching that intersection move is the tracking job, and the two answers have different shelf lives.
What each quadrant looks like when it is filled in
A finished quadrant reads as a sentence with a number in it. Here is what that looks like in practice for each box.
Strengths. "We hold 1,800 of the 12,000 followers our closest competitor has, and most of that overlap sits in the high-engagement band." The claim is checkable. The second clause stops anyone celebrating an overlap made of dormant accounts.
Weaknesses. "About 10,200 accounts already interested in this category have never seen our posts, and 22 percent of our own follower base is classified inactive." Both halves are addressable, and both have an exportable list behind them.
Opportunities. "Eleven accounts appear in the following lists of all three category leaders, and we currently follow two of them." That is an outreach queue, not an aspiration, and it took one Following-mode comparison per pair to build.
Threats. "The competing founder followed nine accounts in the recruiting category over six weeks, then two of our partner accounts unfollowed them." Movement, dated, with the profiles attached, which is the only version of a threat anyone can act on.
Notice what none of those sentences contain: an adjective doing the argumentative work. Every clause names a count, a share, or a dated event, and every one can be re-pulled next quarter to see which direction it moved.
How to run a SWOT analysis on Twitter step by step
Filling a SWOT analysis on Twitter with evidence takes two moves: compare your account against a direct competitor for the strengths and weaknesses boxes, then track that competitor's follow activity over time for opportunities and threats. The comparison takes two public handles and one radio-button choice. The tracking rule is set once and reports on a schedule. The five steps below run in that order.
Watch the numbers land: pulling account-level X analytics without an X Premium subscription, which is where the strengths box gets its first number.
https://www.youtube.com/watch?v=tAXZ5hamLVY
Produce the snapshot that fills the top half
- Log in to Circleboom Twitter and hand over access to the X account you are benchmarking from.

- Open the Monitoring menu and select Account Comparison.
- Type your handle and a competitor's handle into the two input fields, choose the Followers option, and run the comparison. Both accounts must be public.
- Sort the results by the Active & Inactive column, record the high-engagement share as your strengths line, and subtract the total shared count from the competitor's follower count for your weaknesses line.
Produce the delta that fills the bottom half
- Create a tracking rule on that competitor through the setup wizard, choose Following as the tracking type, select Track Both, and pick daily or weekly email reports.
Running the comparison before the tracking rule is what keeps the second half cheap. The snapshot tells you which rival is actually adjacent to you, so the tracking rule watches an account you already have a reason to watch instead of collecting movement you will never act on.
At a glance: compare followers, read the engagement bands, subtract for the gap, repeat the run on Following against two further leaders, then track the closest rival.
Which competitor belongs in the comparison
The choice of benchmark decides whether the output is useful, and size similarity matters more than category similarity.
Compare against an account roughly in your own size band and the overlap is large enough to read, the gap is realistic, and the weaknesses number describes an audience you could plausibly reach this year. Compare against a category giant and the overlap collapses toward zero, which tells you almost nothing except that you are smaller, a fact you already had.
Two benchmarks work better than one. Pick one account you believe shares your audience and one you believe does not, then check whether the data agrees with you. Where it disagrees is where the SWOT earns its afternoon, because a competitor you assumed was adjacent and turns out not to be has been shaping your content plan for no reason.
The comparison also runs on two accounts that are neither of them yours, which is how you read the shared core of a market without your own position distorting the picture.
What the finished grid changes about your plan
A quantified SWOT converts each quadrant into a different kind of task. The strengths box becomes a retention argument. The weaknesses box becomes an audience size you are trying to reach, with an exportable list of exactly who those accounts are.
The opportunities box is the one that surprised me most. Several respected people in your category vetted those accounts before you ever heard of them, and none of that vetting had anything to do with your outreach.
That is a warmer starting point than a name lifted from a keyword query.
Circleboom is listed on X's Enterprise customer directory, so every figure in the grid came from sanctioned platform access rather than a scrape, and the document survives being questioned. That matters when a quadrant becomes a budget line.
Two constraints worth writing on the slide
Very large accounts return a partial list. The results header states how many accounts were actually fetched from each side, which is why percentages travel better than raw counts when the audience runs into the millions.
Tracking runs on scheduled snapshots rather than a live feed, so there is lag between an event happening on X and a bar appearing on your chart. For a quarterly threat quadrant that is invisible. For same-day reaction it is the wrong instrument, and the email alerts only fire when a snapshot finds an actual change.
The display side has a ceiling too. Results show up to 5,000 shared accounts at a time, and re-sorting on any column pulls a fresh set of names into that window, which keeps a very large overlap reachable in pieces.
Pair the grid with a Twitter account analysis when one competitor deserves a closer read on its own.
The weaknesses number also has a discovery side. If 10,200 category-adjacent accounts have never seen you, some of them are searching terms your profile does not answer, which is where a Twitter SEO pass earns its place in the plan.
What to do next
Four moves turn the template into a document with numbers in it:
- Pick one competitor whose audience you believe overlaps yours, and one you believe it does not.
- Run the follower comparison against both, and record the engagement-band split, not only the totals.
- Switch to Following mode against two more category leaders and keep whoever appears in all of them.
- Set a single tracking rule on the closest rival, then leave it alone for a quarter.
The grid stops being a slide and starts being a work queue at the moment each box carries a figure someone could check.
Common questions about SWOT analysis on Twitter
Does this need access to my competitor's account?
No. Both compared accounts only need to be public, and you never need credentials for the account you are benchmarking. Nothing stops you leaving yourself out of the run entirely and putting two other players head to head instead.
Should I compare followers or following?
Compare followers for the strengths and weaknesses half, because shared followers describe audience overlap. Compare following for the opportunities half, because the accounts several leaders all follow are the trusted nodes of the category. To track someone's X followers and followings over time, each direction is a separate tracking rule.
Which mistake shows up most often on a first pass?
Picking a competitor who is too large. I did this repeatedly, and the overlap comes back tiny, which reads as failure when it only means the two accounts are not really competing for the same audience. Benchmark against accounts within a comparable size band first.
Can I export the quadrant evidence?
Yes. Comparison and tracking results both export to CSV for reporting, and every download spends export tokens from the balance shown at the top of the page. The Comparison History panel keeps previous runs with their dates so you can see how current a cached result is before quoting it.