

There are several ways to check your tweet performance, but if you want access to the most detailed and useful analytics, the best option is Method #1: Circleboom Twitter Analytics.
It provides more insights than even X Premium, and also gives extra tools for sorting, comparing, and reusing your strongest tweets — something the default Twitter analytics does not offer. ⬇️
However, to understand the difference clearly, let’s walk through every method, what data they provide, and where each one reaches its limits.
Why Understanding Tweet Analytics Matters
Tweet performance can feel unpredictable when you're only looking at likes and impressions. Some tweets go viral unexpectedly, while others you spent time crafting barely get seen.
Analytics help reduce the guesswork by showing you:
➡️ What topics, formats, and tones your audience responds to
➡️ Which tweets lead to profile visits and follower growth
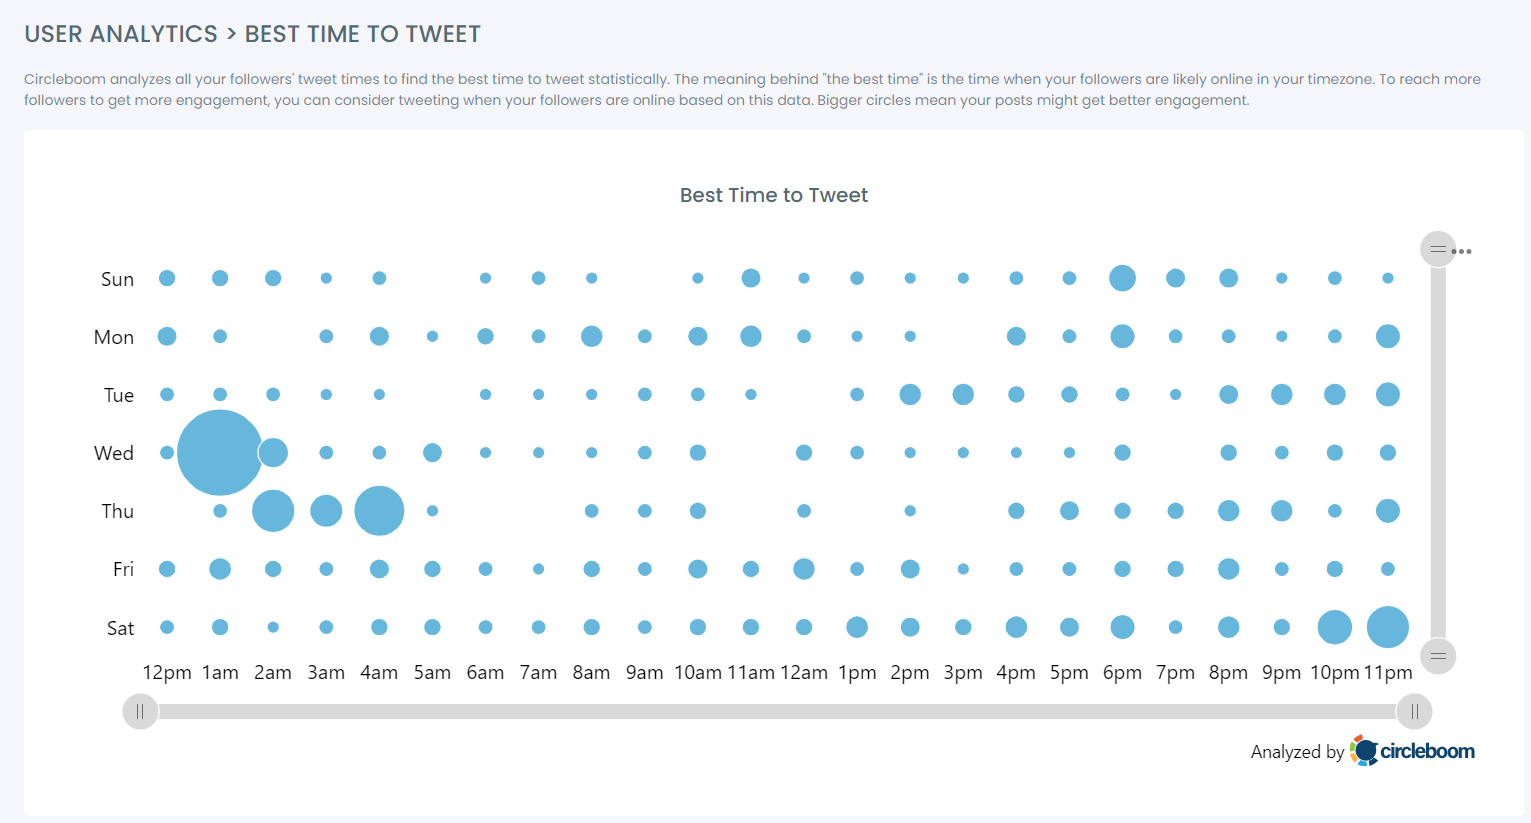
➡️ What time of day your audience is most active
➡️ Which tweets you should repeat or rework, instead of constantly writing new ones
When you understand your data, tweeting becomes less about “hoping something works” and more about building on what already does.
Key Metrics to Track
These are the core metrics that matter when evaluating tweet performance:
Twitter/X Analytics gives you data, but you need to know which numbers to watch:
- Engagement Rate. Divide engagements (likes, replies, retweets, clicks) by impressions. A low percentage shows your content isn’t resonating with those who see it.
- Likes (Favorites): A low-effort form of approval, indicating basic positive sentiment.

- Retweets (Reposts): A powerful form of amplification. When someone retweets your content, it extends your message to their followers, significantly boosting your impressions and reach. It's a strong indicator of content resonance.

- Replies: Direct conversations. Replies are invaluable for community building, gathering feedback, and fostering deeper connections. They show high intent and interest.

- Profile Clicks: When users click on your profile name or picture. This indicates curiosity about your brand or persona beyond the single tweet.

- Link Clicks: Crucial for driving traffic to your website, blog, or other external content. High link clicks often translate directly to business objectives like leads or sales.

- Media Views (Photo/Video clicks): Clicks to view attached photos or play videos. This shows interest in your visual content and that your multimedia is compelling.

- Demographics. Check language and location data. If your target audience is U.S. marketers but most of your followers are inactive accounts overseas, something’s off.
Note:
The examples and visuals you will add in this article can be taken from Circleboom X Post Analytics.
You can check your own metrics in the same way there.
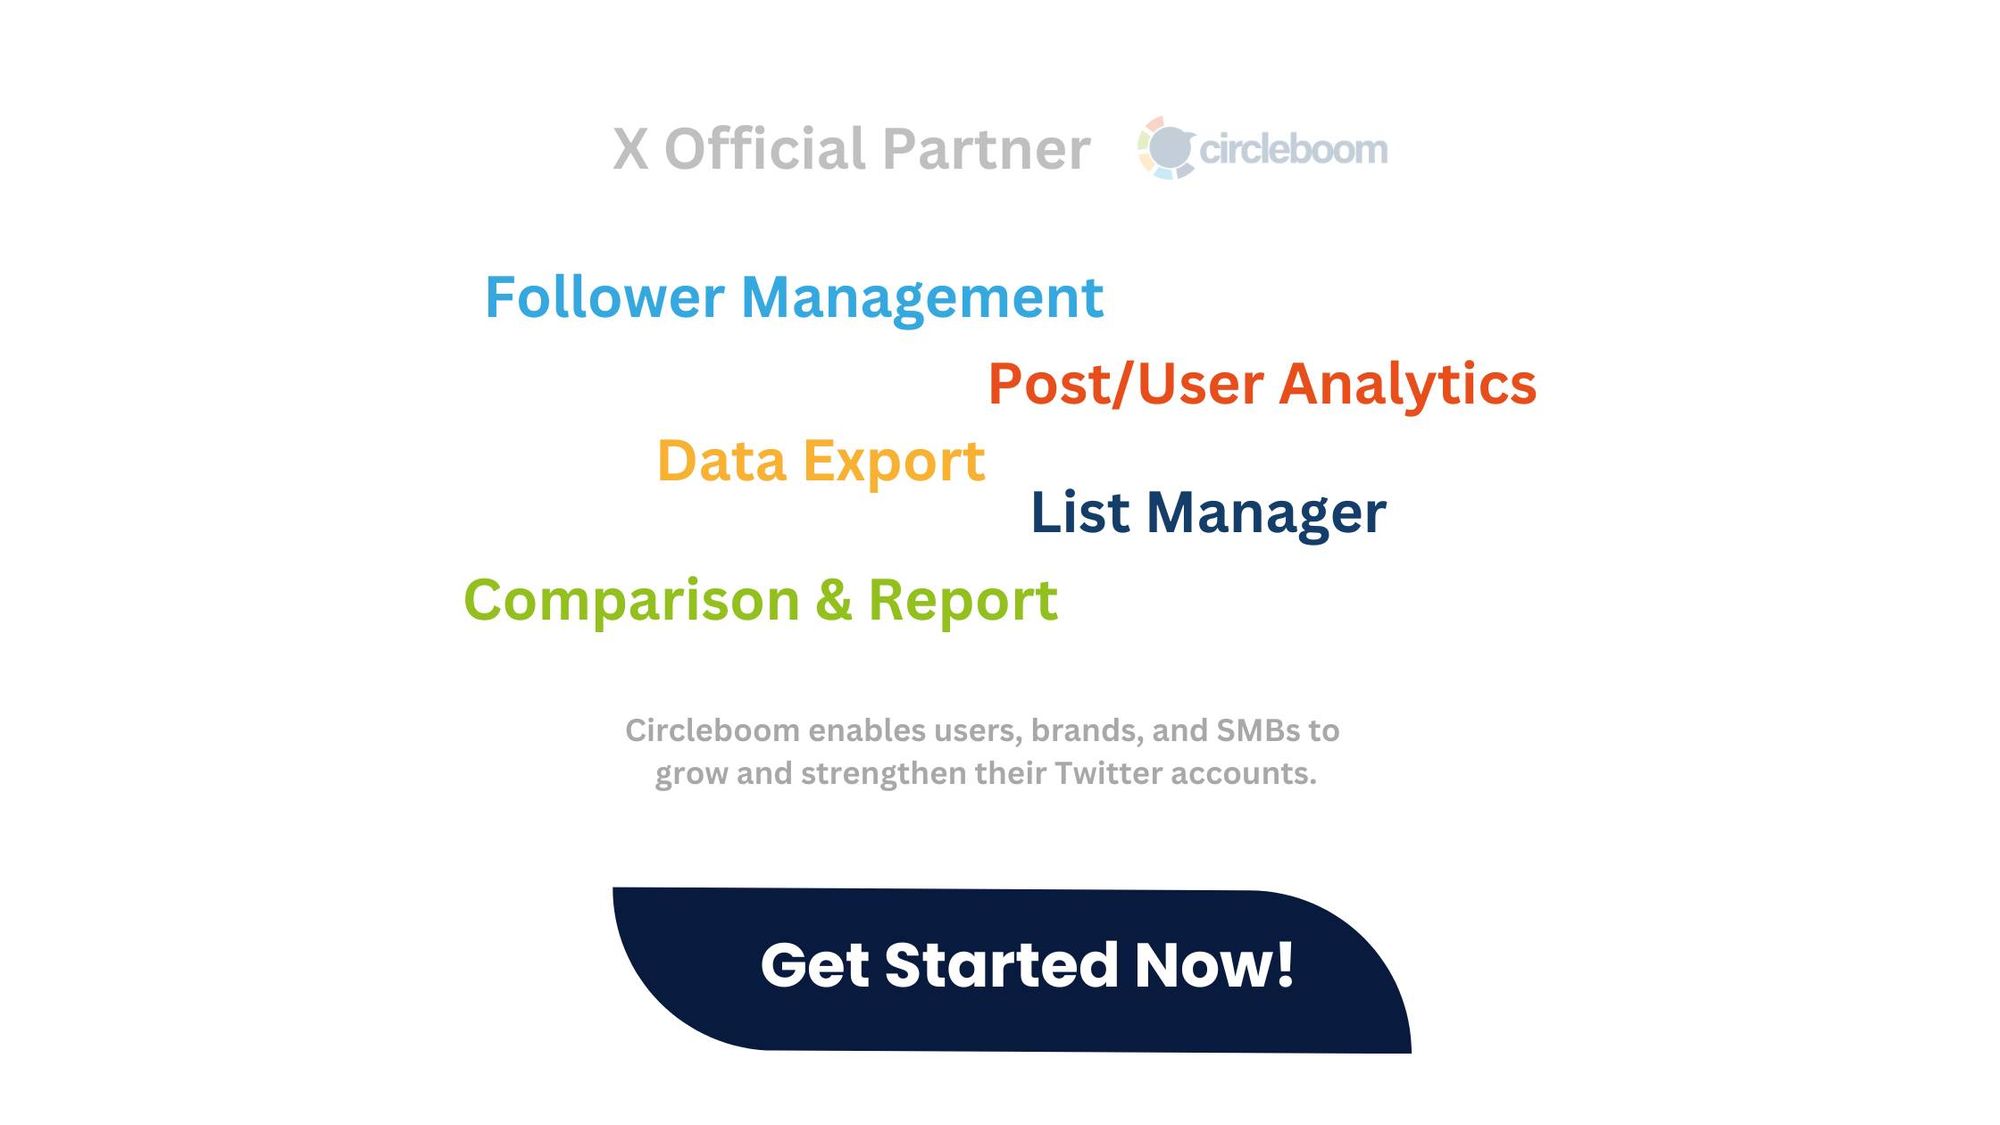
⭐ Method 1 (Best): Circleboom Twitter Analytics
Before explaining how to use it, let’s clarify what Circleboom is.
Circleboom is an official Enterprise Developer of X/Twitter, built to help users manage their accounts safely within platform limits.

This means you can analyze, clean up, and optimize your account with full compliance and no risk of suspension, unlike many unofficial third-party tools.
Circleboom focuses on:
➡️ Follower / following analysis
➡️ Tweet scheduling and AI rewriting
➡️ Content reuse and performance optimization
And the best part:
You do not need X Premium to access these insights.
How to Use Circleboom to Analyze Your Tweets
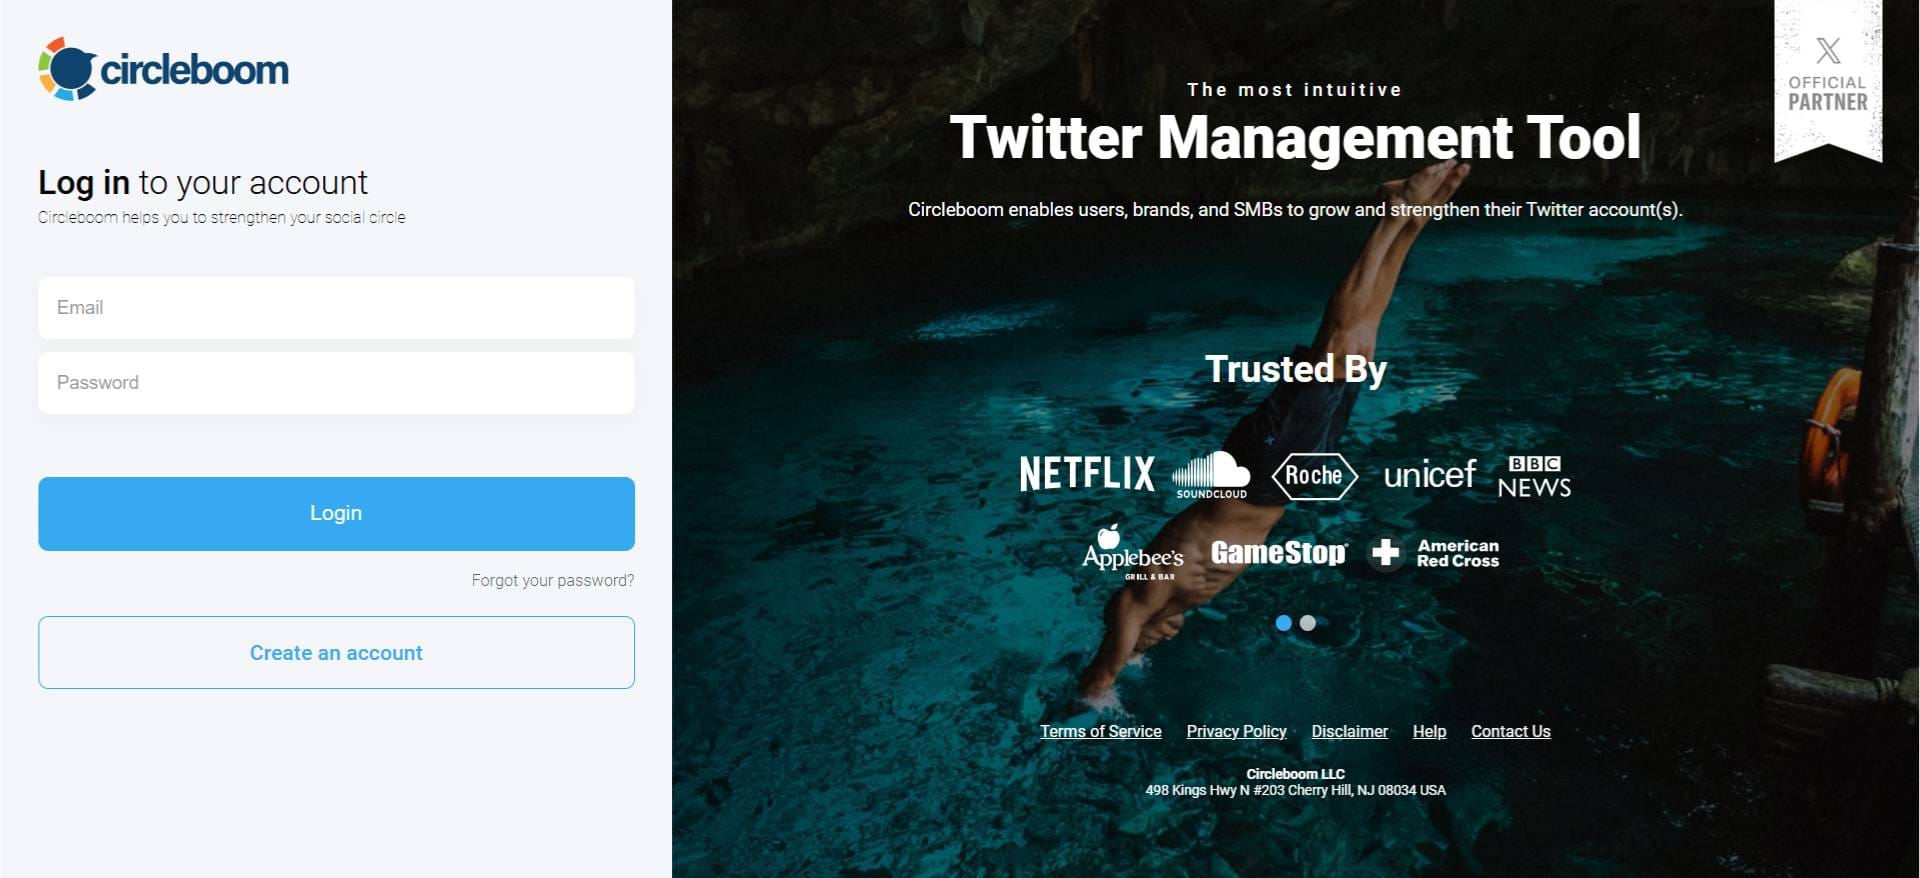
Step #1: Log In to Circleboom Twitter
Go to the Circleboom Twitter website and log in with your credentials. If you’re a new user, sign up—it’s quick and easy!
Step #2: Navigate to the Analytics Menu
From the left-hand menu, click on "Post Engagement Analytics" from the X Post Planner Menu.
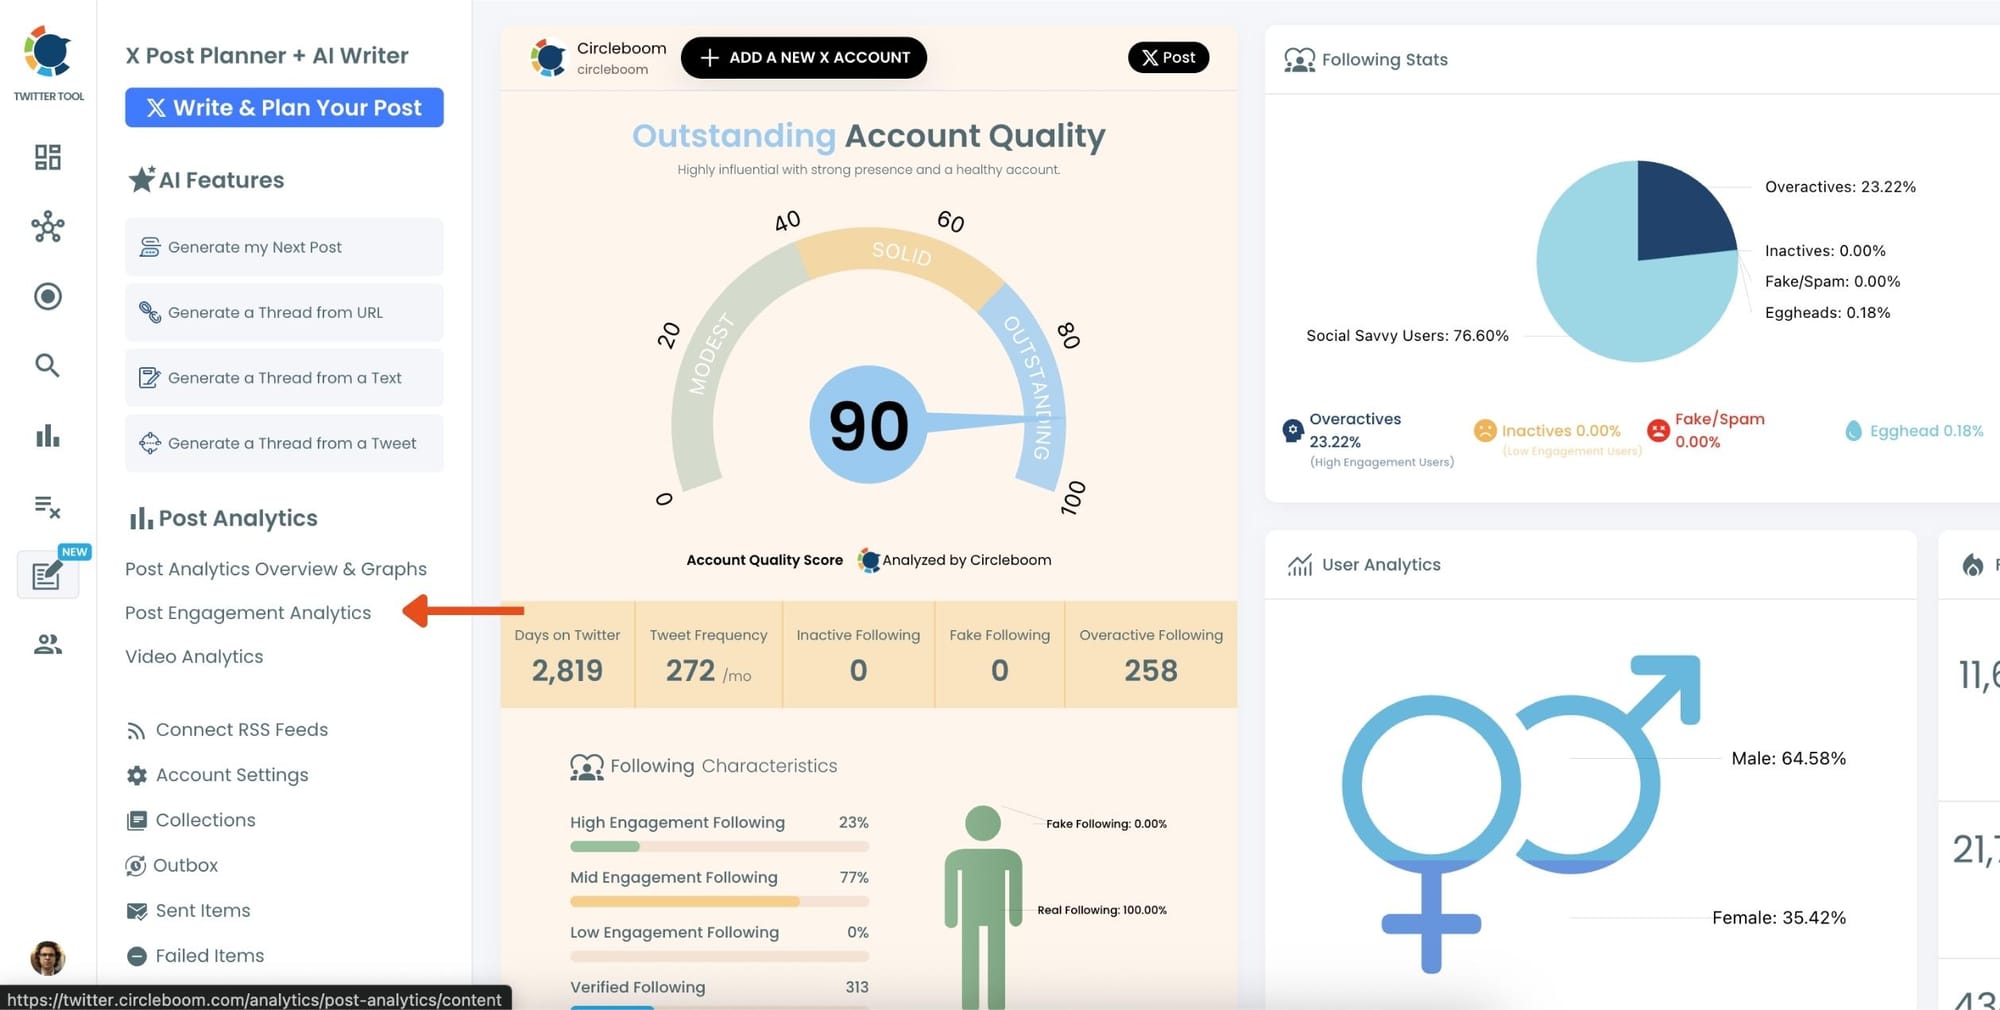
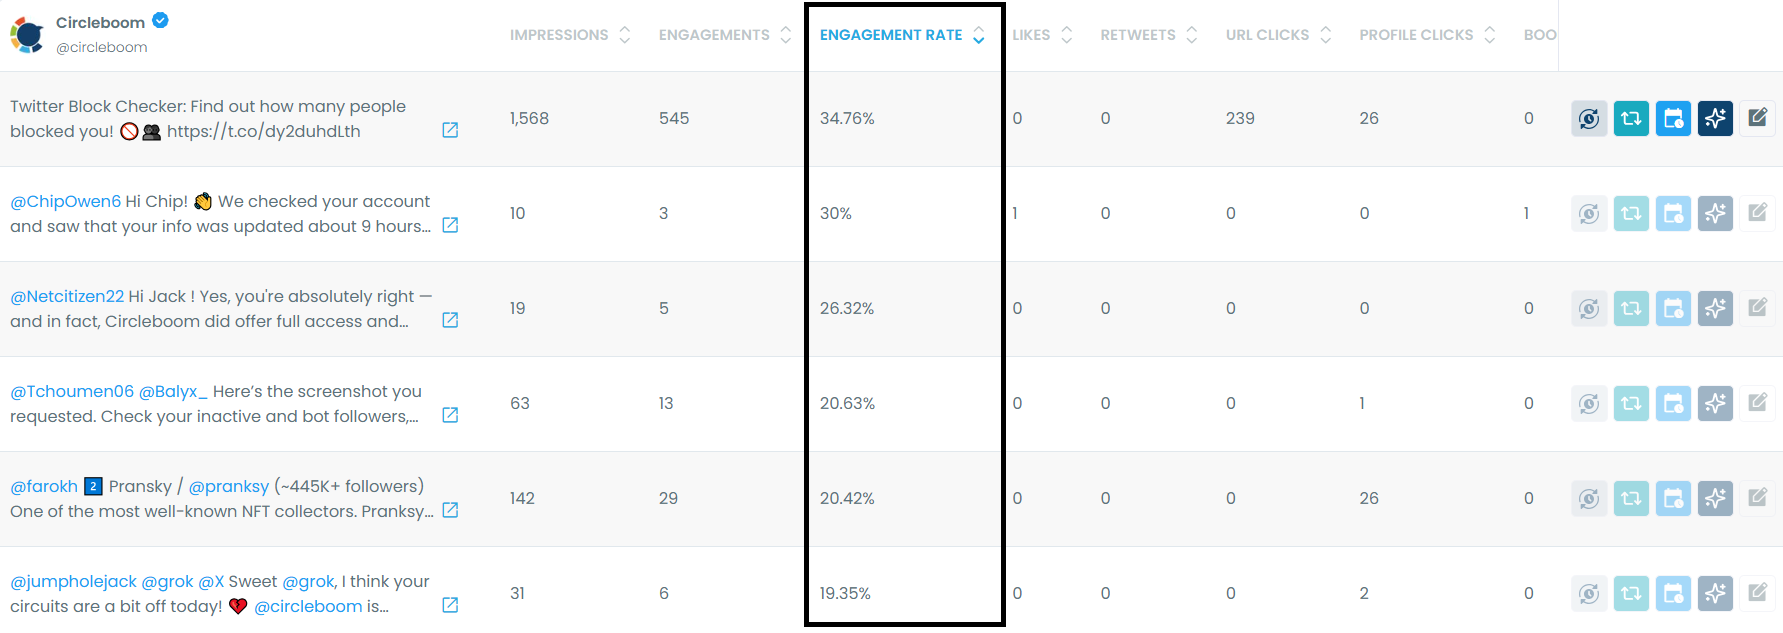
Circleboom will display a detailed breakdown of your posts, including metrics like impressions, likes, retweets, replies, and more.
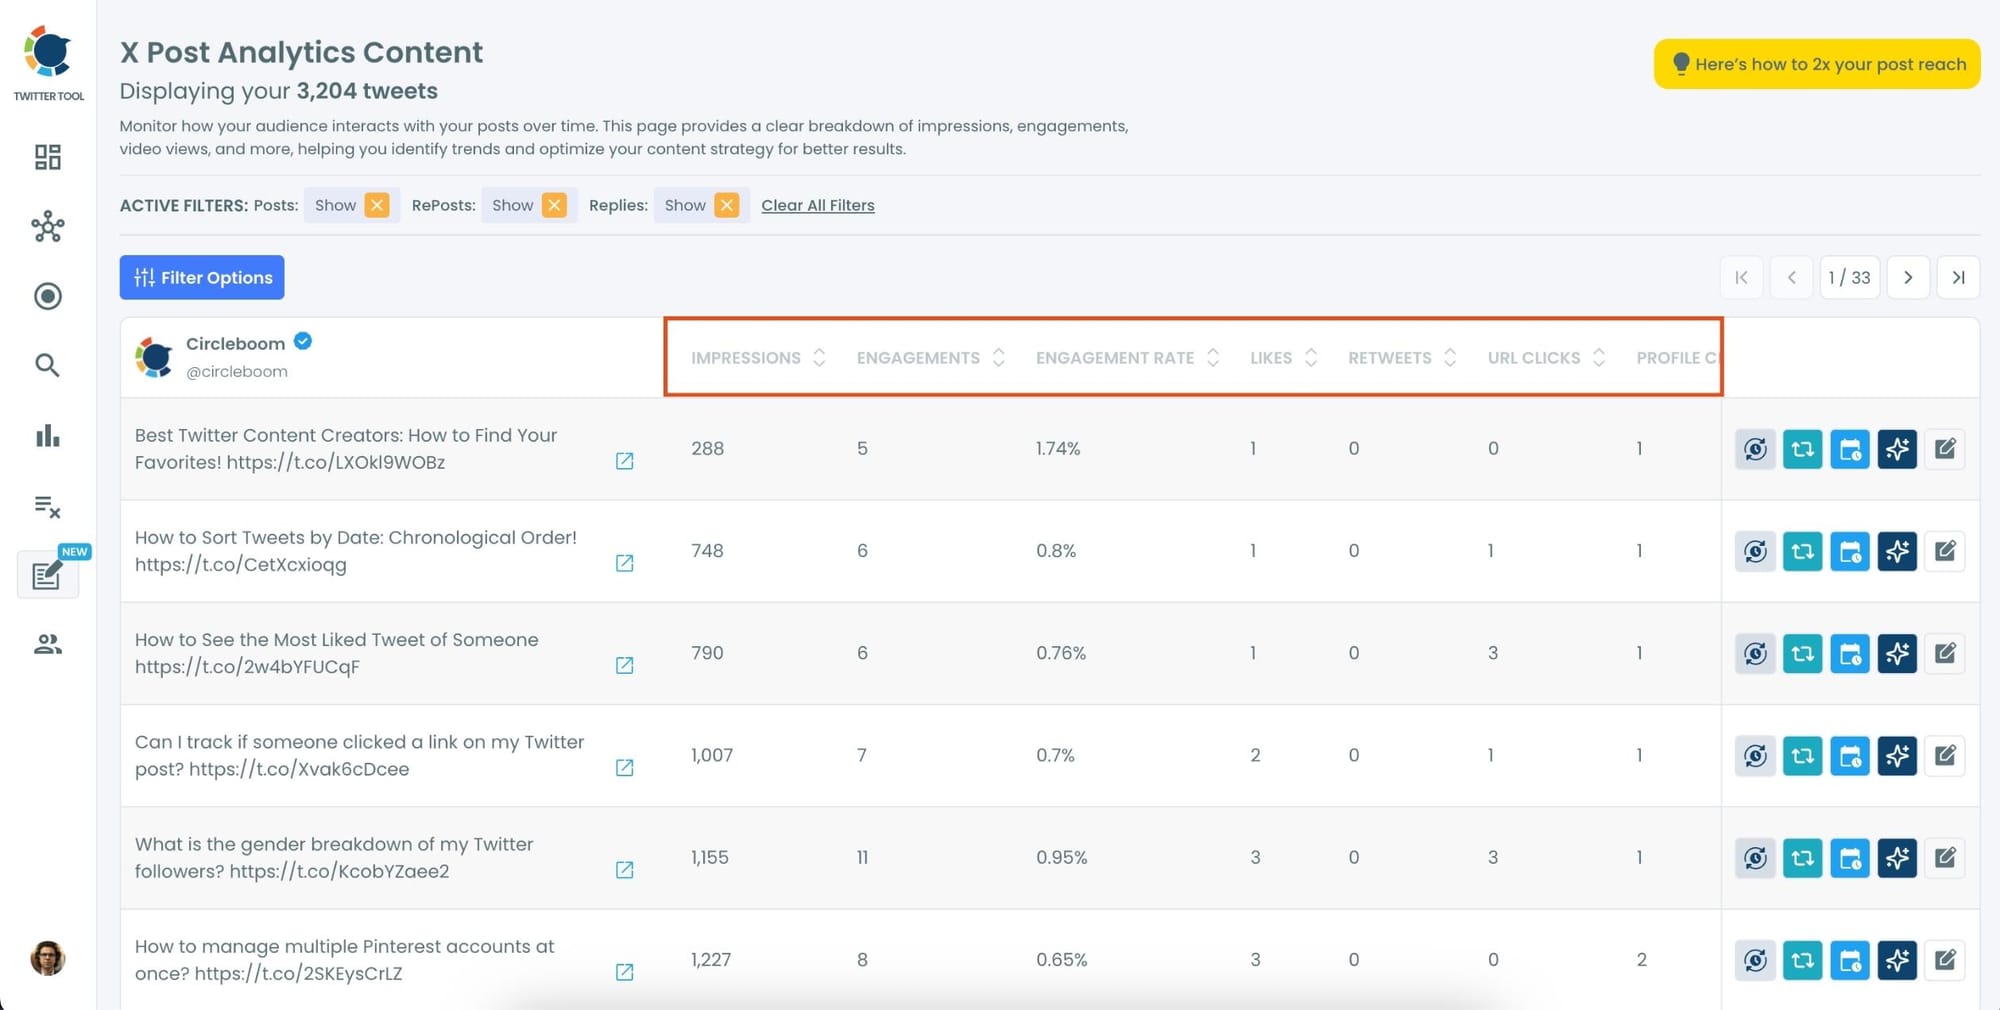
Step #3: Sort your tweets.
In this section, you can view all the detailed metrics I mentioned above. If you want to focus on a specific metric, you can simply sort your tweets by it.
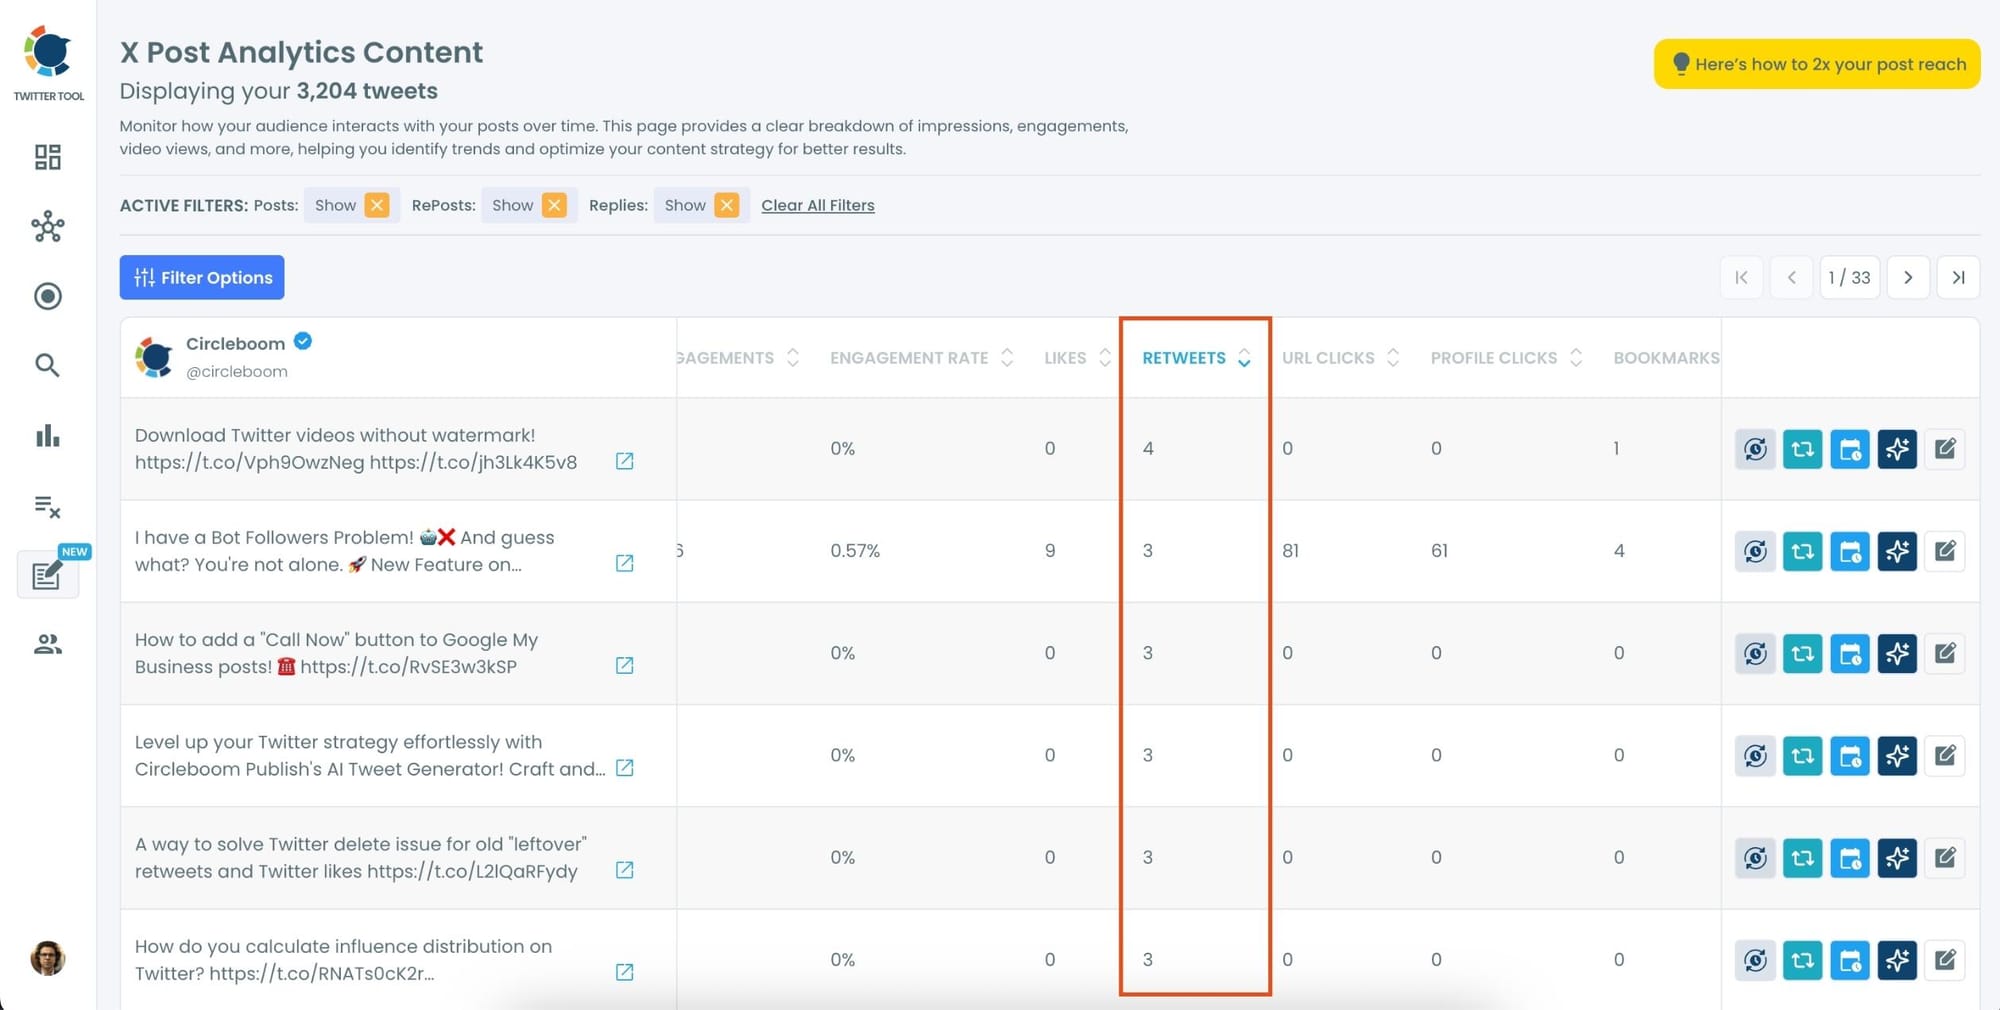
For example, if you'd like to see which of your tweets received the most retweets, locate the "Retweets" column in the content list.
Click on the column heading, and Circleboom will automatically arrange your tweets from the highest to the lowest number of retweets.
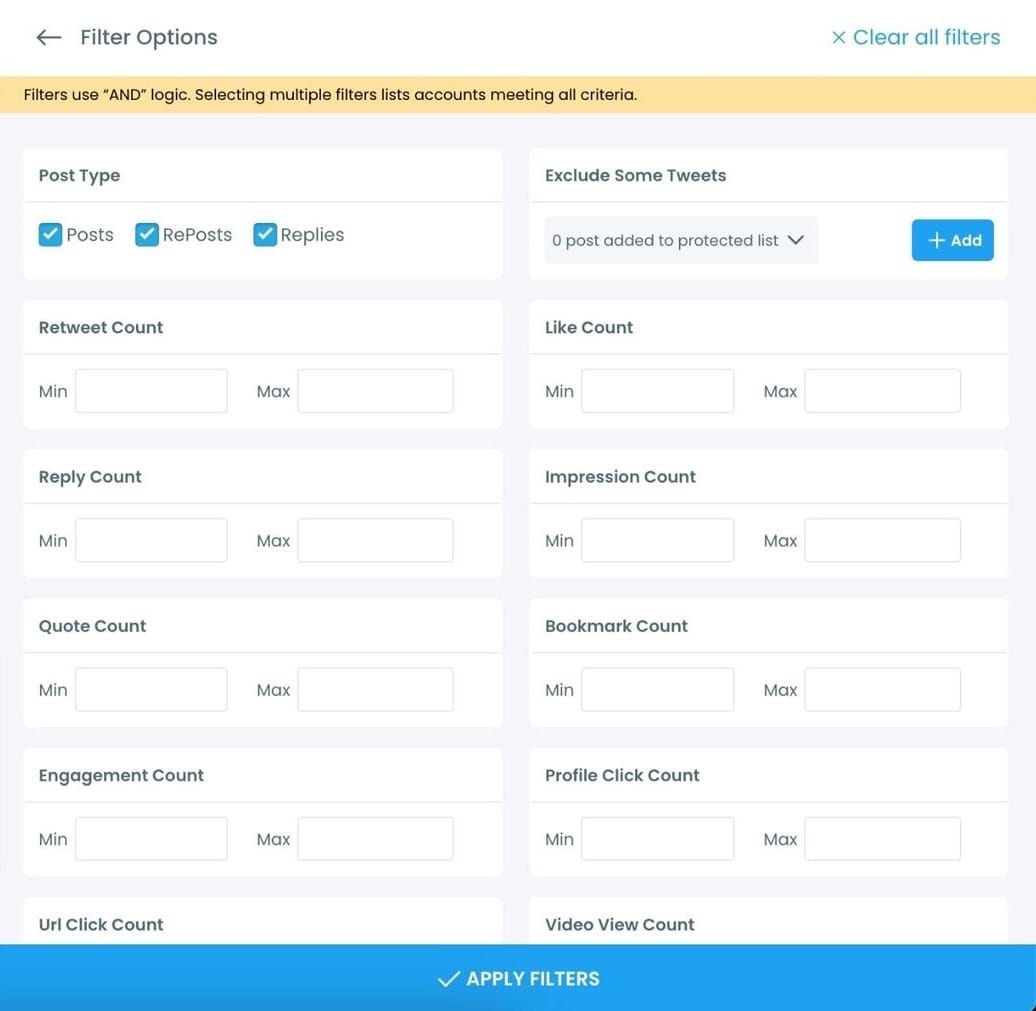
Optional Tips: Use Advanced Filters
For a more focused analysis, click on the "Filter Options" button.
You can refine your search by metrics like date, engagement type, or other performance indicators to identify specific trends.
With these analytics, I could see which tweets performed best and the patterns behind their success.
Step #4: Choose What to Do Next
Circleboom quickly sorts your tweets from the most retweeted ones to the least.
For any tweet in the list, you can:
🟢 Set Auto-Retweet: Reshare it at regular intervals automatically.
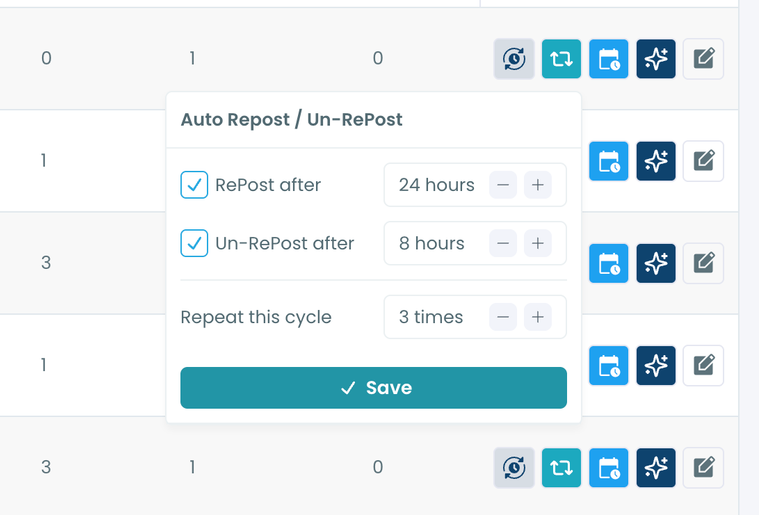
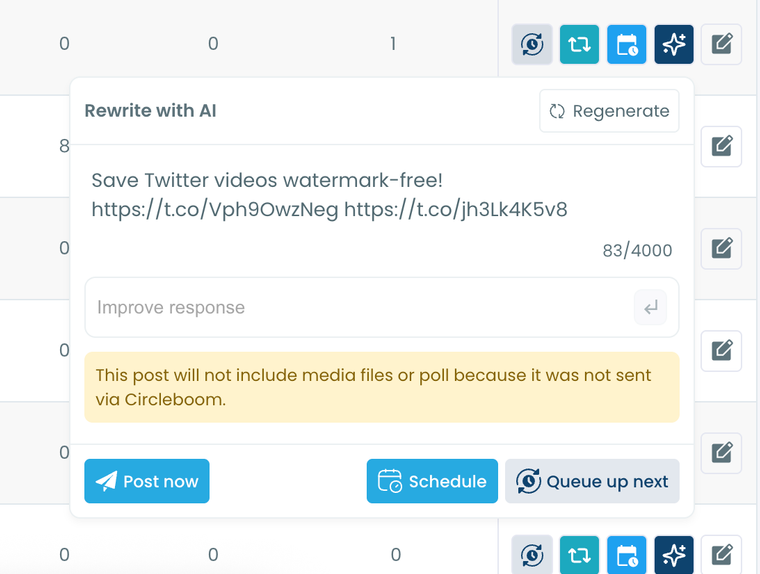
🟢 Rewrite with AI: Generate a fresh version of the tweet with improved wording.
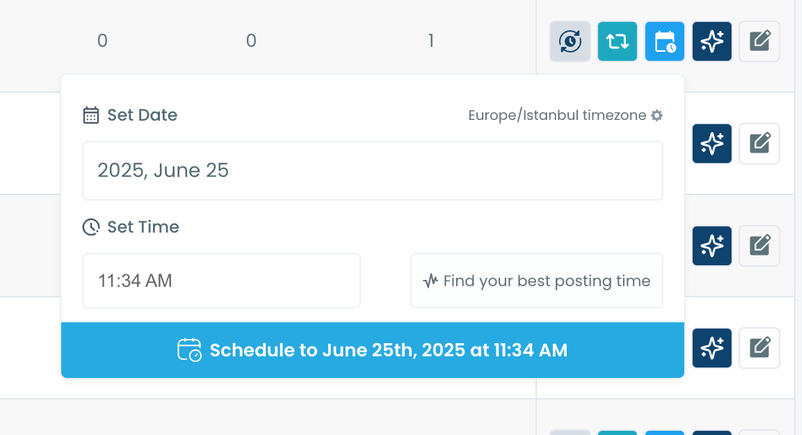
🟢 Reschedule: Share it again at a better time based on follower activity.
Once you’ve set it up, Circleboom handles everything. No more manual retweeting, tracking, or redoing the same steps over and over.
Circleboom Account Analytics — Beyond Tweet Performance
Circleboom doesn’t stop at tweets.
It also helps you understand your audience, which is the real key to growth.
You get:
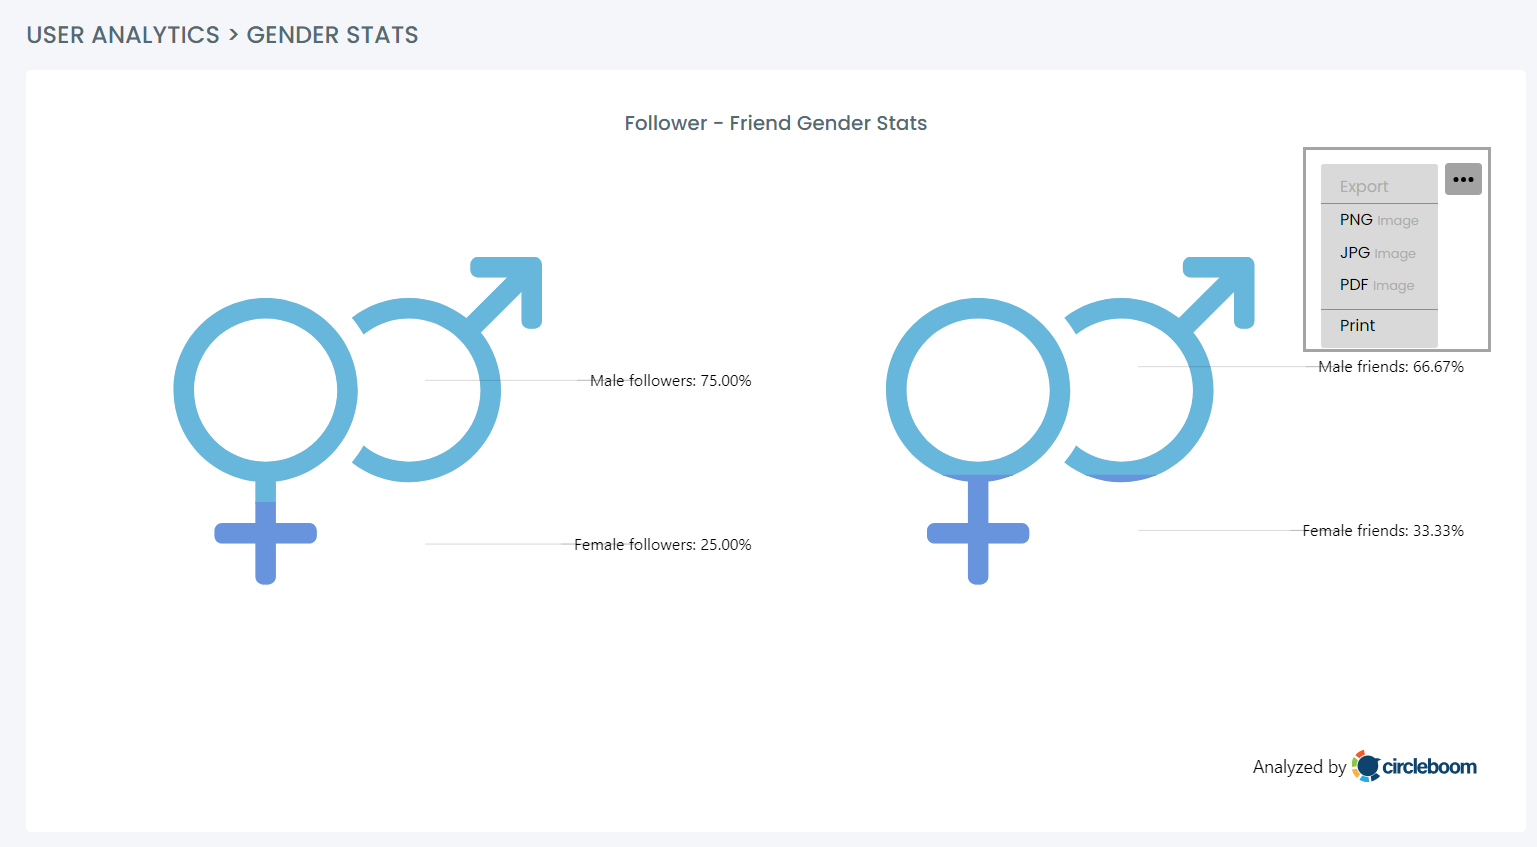
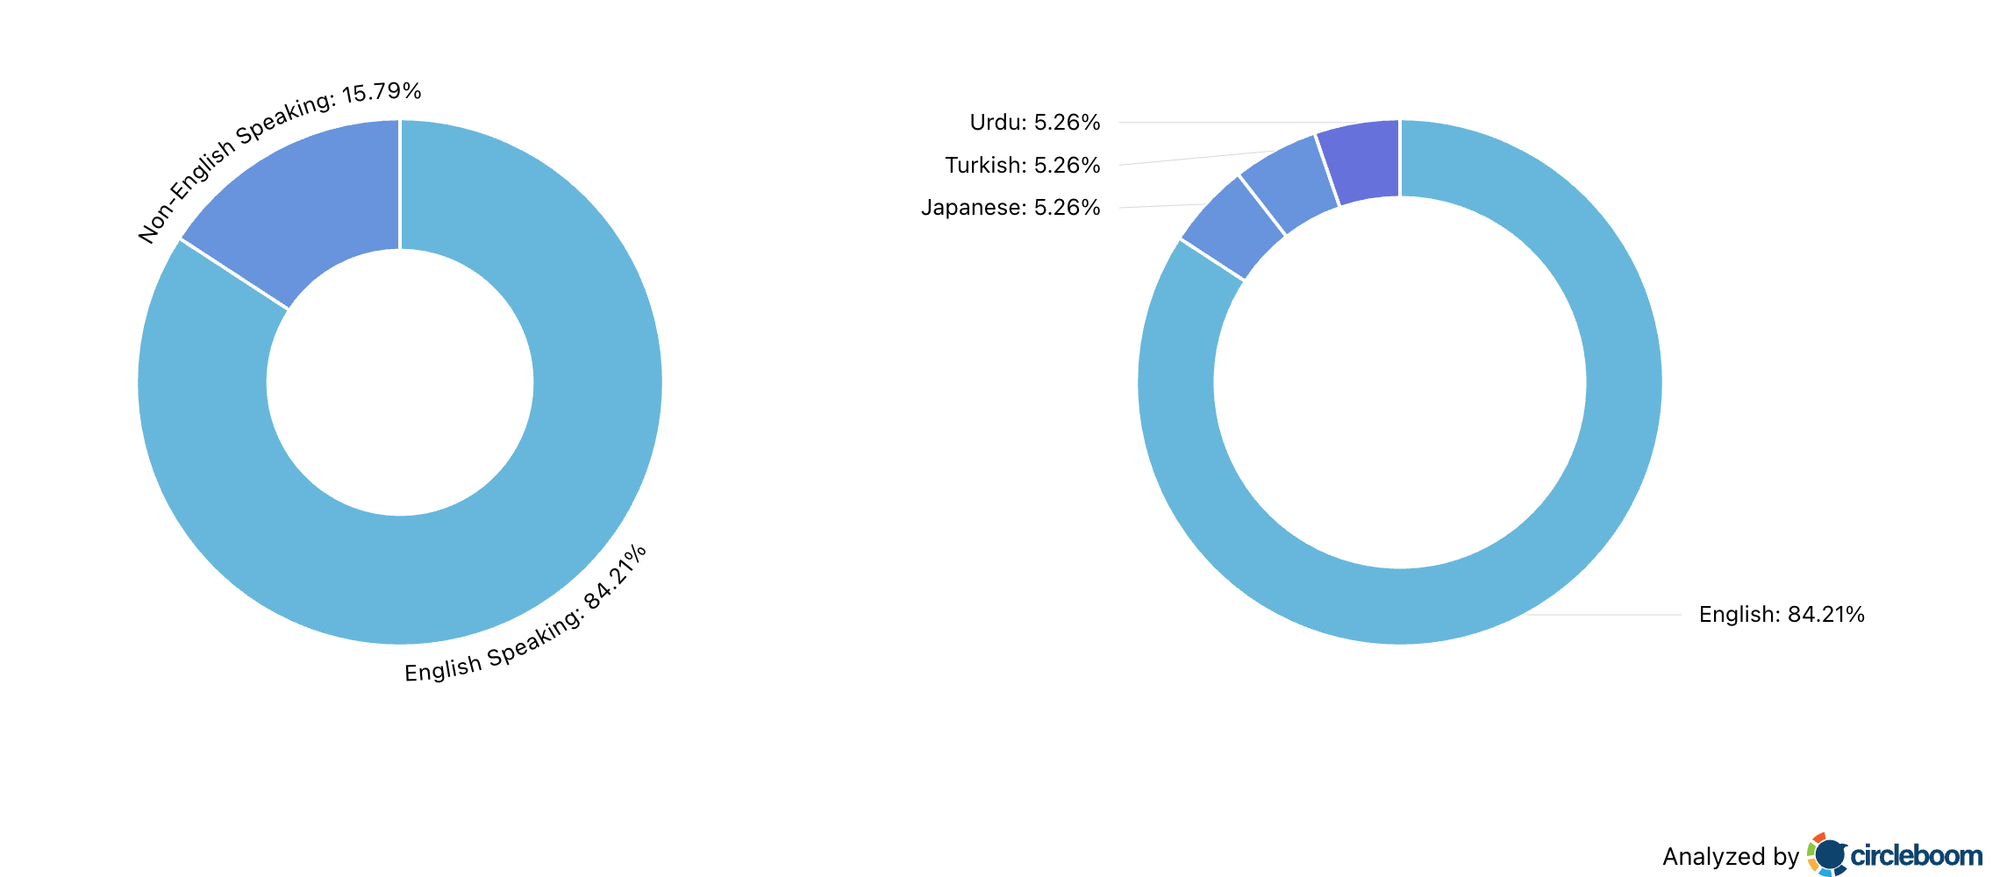
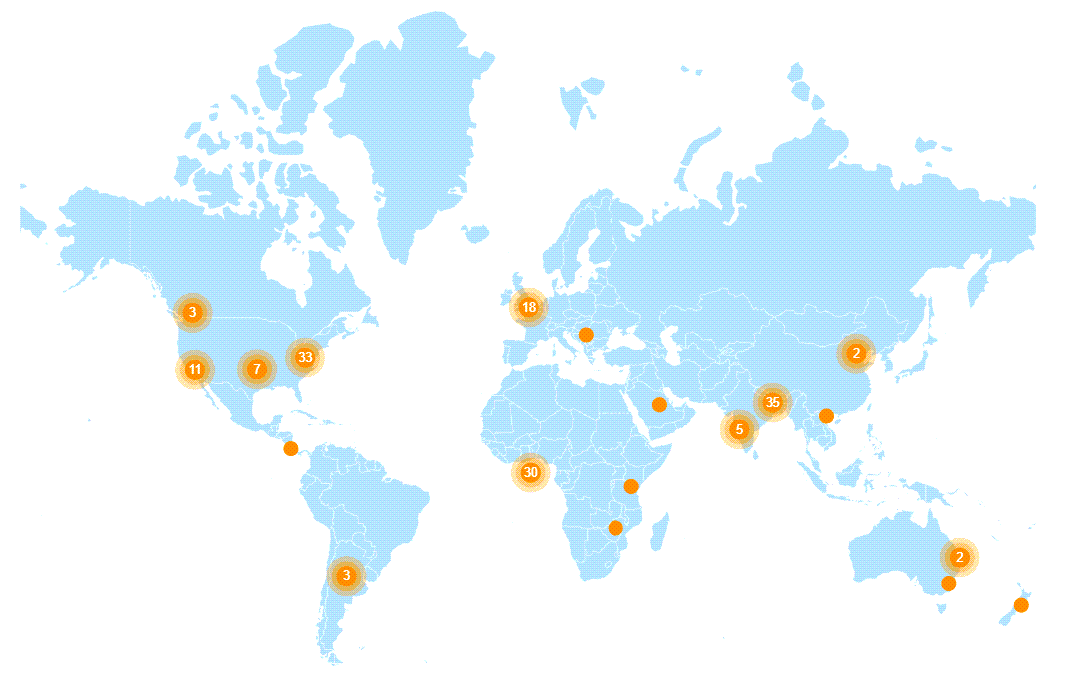
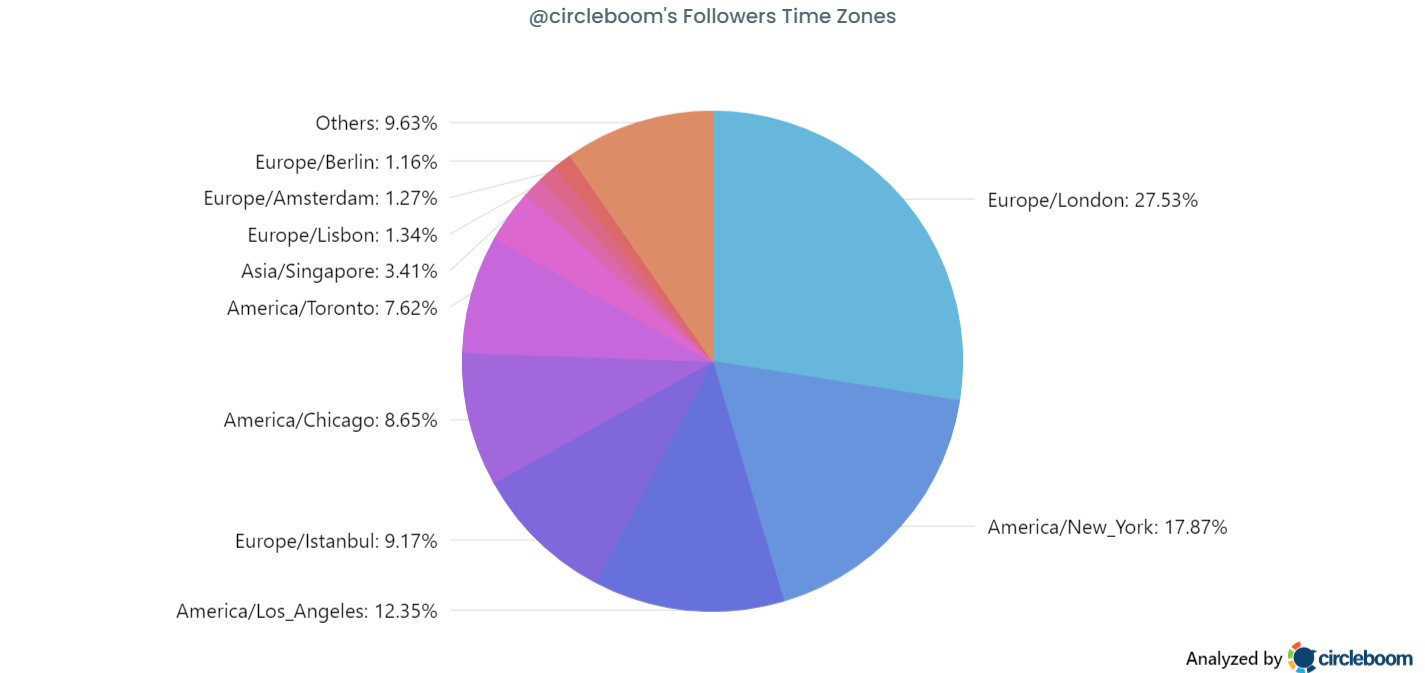
- Interest Cloud (the topics your audience cares about most)

Not all of these insgigts are exist in X Premium’s analytics, even when paid for.
Knowing who you’re talking to makes it much easier to write tweets that resonate.
Circleboom vs X Premium Analytics
Even if you pay for X Premium, the analytics you get are still quite limited.
You can see some extended metrics, yes — but you can’t sort, filter, compare, or reuse your best-performing tweets.
And most importantly, you don’t get any audience insights that help you understand why certain content works.
This is where Circleboom makes the biggest difference.
| Feature | X Premium | Circleboom |
|---|---|---|
| Tweet Insights | ✅ Available | ✅ Available (more detailed + visual) |
| Sort Tweets by Performance | ⚠️ Limited to a few basic metrics | ✅ Sort by any metric (likes, retweets, engagement rate, etc.) |
| Follower Demographics | ✅ Basic demographics only | ✅ Demographics + Interests, Languages, Locations, Timezones |
| Best Time to Post | ⚠️ Shows activity chart only (no recommendations) | ✅ Provides clear posting suggestions based on audience activity |
| Reuse High-Performing Tweets | ❌ Not supported | ✅ Rewrite, repost, schedule, and auto-retweet top tweets |
| AI Rewrite / Refresh Tweet | ❌ Not available | ✅ Built-in AI to rewrite and repurpose top-performing content |
Method 2: Use “View Tweet Activity” on Twitter
Twitter lets you view basic performance insights on any individual tweet.
How to Use
- Open one of your tweets.
- Tap the bar-chart icon (View Tweet Activity).
- Review impressions and engagement data.
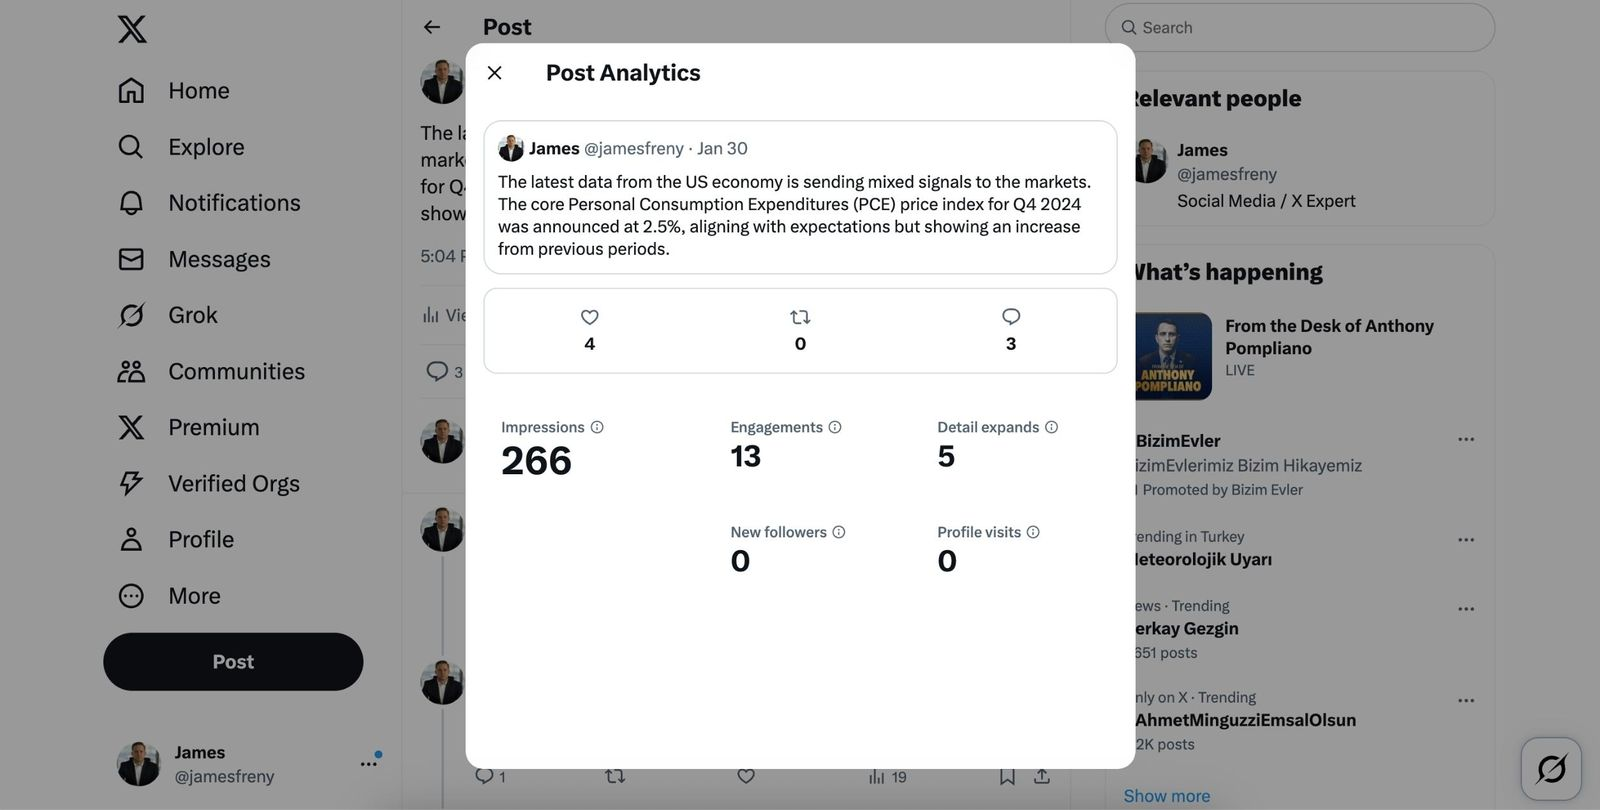
What This Is Good For
🟢 Quick, instant checks
🟢 Understanding basic tweet visibility
🟢 Seeing whether a post received surface-level attention
Where It Falls Short
❌ Shows only one tweet at a time
❌ No comparison of best vs. worst performing tweets
❌ No sense of patterns over time
❌ Doesn’t help you identify which formats work better
❌ No insight into audience behavior
It’s helpful in the moment, but it doesn’t provide enough information to improve consistently.
Method 3: Download Your Twitter/X Archive
This method gives you a copy of all your account data, including your entire tweet history — but it does not arrive in a ready-to-analyze spreadsheet.
How to Use
1. Go to Settings & Privacy → Your Account
2. Select Download an archive of your data

3. Verify your identity (SMS/email confirmation)
4. Wait for Twitter/X to prepare your archive (may take hours or days)
5. Download the .zip file to your computer
6. Extract it — inside, you’ll find:
- JSON data files (tweet history, messages, profile data, etc.)
- A “Your archive.html” file to view the data in your browser
What You Can Do With It
When you open the HTML viewer, you’ll be able to:
- Scroll through your tweet history
- Search tweets by text or date
- Review activity in a browser-style interface
Why It Can Be Useful
🟢 You get a full historical record of your tweets
🟢 Useful for searching older tweets or auditing past content
Why It’s Not Practical for Analytics
❌ The data is not visualized
❌ The tweet data is stored in JSON, not a spreadsheet
❌ To analyze it deeply, you must manually convert tweet data to CSV or use custom tools/scripts
❌ No automatic trend detection
❌ No engagement overview, best/worst tweet comparison, or time-based insights
In short:
Method 2 gives you everything, but nothing is organized for analysis.
So while it’s powerful for data retrieval, it's not efficient for improving your Twitter growth strategy day-to-day.
Conclusion
Each method offers a different level of insight:
- Method 1 is good for quick, single-tweet checks — but it doesn’t help you understand patterns or improve strategically.
- Method 2 gives you complete historical data — but it’s too manual and time-consuming for everyday use.
- Method 3 (Circleboom) gives the clearest and most actionable analytics, helping you understand both your tweet performance and your audience — without needing X Premium.
If your goal is to grow with intention — not by guesswork — you need visibility into what actually works, when your audience is active, and which tweets are worth repeating or rewriting. Circleboom makes that simple by putting everything in one place and helping you reuse your strongest content instead of starting from zero every time.
Better analytics lead to better tweets.
Better tweets lead to better engagement.
And once you know what works, growing on Twitter/X becomes much easier.


)
%20do!)