
How do you get a monthly competitor report for X without rebuilding it every month? You set it up once inside a benchmark report, choose how many months it runs and which day it runs on, and each dated report then appears by itself.
How do you get a monthly competitor report for X?
Enter your peer accounts, choose Keep it up to date every month, then set the number of months and the first report day. Circleboom pulls a fresh side-by-side benchmark of those X accounts on that day through official X Enterprise APIs.
→ Set up your monthly competitor report in one pass
What makes a monthly report on Twitter hard to keep up
A monthly report on Twitter usually dies from inconsistency, long before anyone decides to stop it.
The first one gets done with care. The second comes late, the third uses a different set of rivals, and by the fourth nobody can say whether two numbers are comparable.
Leadership asks two things: are we behind, and on what?
Own-account dashboards cannot answer either, and the difference is covered well in this look at Twitter analytics for business.
You need peers, pulled on the same date, measured the same way.
I see first-time setups go wrong in one place more than any other: people treat the schedule as the decision.
The bigger decision is which accounts go in, and the date comes after that.
If that is the job in front of you, you can get your monthly competitor report on X in one sitting and move on to reading it.
What the X competitor benchmark gives you each month
Circleboom's X Competitor Analysis & Benchmark Report feature compares up to 5 X accounts in one 9-section report, and each scheduled run repeats that comparison with fresh data. Your set can be your own account plus up to 4 competitors, or up to 5 other accounts without your own.
Each monthly run covers the same ground for every account:
- Essentials and audience quality.
- Demographics and geography.
- Posting behavior and content format.
- Engagement and Impression/Views.
- Content leaderboards and video performance.
Every run is dated and saved under Your saved analysis. Earlier runs stay in that set's Past Analyses expander, so you can open any two months and compare them.
With Circleboom, you can also check the limits early, before you plan around an account. Only public accounts can be compared, and an account above 3,000,000 followers cannot be added.
Owner-only metrics stay out of every column too, including yours. Profile visits, URL clicks and video retention curves never appear, so the table has no blank cells and every row compares like with like.
Once the set passes those checks, you can schedule a monthly competitor report for those accounts and keep the same comparison running for as long as the review needs it.
Should you keep the same competitors in the report every month?
Yes. Keep a recurring set stable, because adding or replacing an account changes the group being measured, and the change can look like a shift in your position.
If you must swap one, write that down next to the report.
Choose direct peers using these checks, since industry alone is too loose:
- Same target market and language.
- Similar account scale.
- Similar publishing purpose and business model.
A regional support account and a global entertainment-led brand can share a sector and still serve different goals.
Save category leaders for a separate set, and study how they work without treating their totals as your targets.
A useful detail for the set size: leaving your own account out frees a slot, so you can run 5 peers instead of 4. If you want your own column in the table, 4 rivals is the limit.
How to get a monthly competitor report for X, step by step
Here is the flow, in order. It splits into three short phases: build the set, set the schedule, then confirm the cost.
Enter the accounts you will keep comparing
- Log in to Circleboom Twitter and connect your X account.

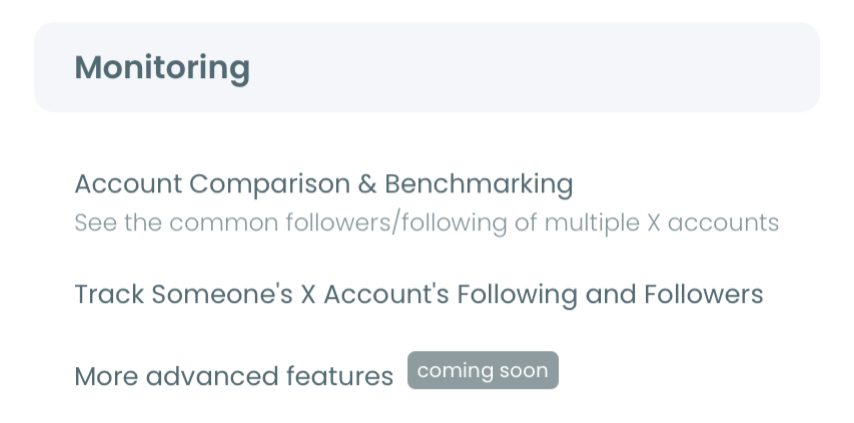
- Go to the Monitoring menu and select the first item, labeled New, which opens the X Competitor Benchmark Report.
- Type each handle into its @ field under Account Handles, and press + for another slot. The counter reads "N of 5 competitors added."
Choose the monthly option and its two settings
- Press Start Competitor Analysis to reach the scheduling choice.
- Select Keep it up to date every month rather than Just this once. The screen describes the 12-month version as today's report plus one a month, 13 reports in total.
- Set MONTHS to how long the series should run.
- Set FIRST MONTHLY REPORT ON to the day of the month you want each run.
Confirm the token cost and start
- Read the cost line, which multiplies competitors by reports and shows your balance.
- Confirm with the primary button. When your balance is short, it reads Buy N tokens and Start Competitor Analysis.
The order matters because each decision limits the next: the accounts set the cost per report, the months set the number of reports, and the balance check comes last, with both numbers known.
Pick a day that falls ahead of your own reporting date, with time left for reading.
Scheduled sets carry a SCHEDULED badge on their card, which is how you confirm the series is live.
Where each scheduled Twitter report shows up
Each scheduled report shows up on its set's card under Your saved analysis, and that card is the one screen you need to learn.
A summary line sits at the top of the list, in the form "4 competitor analysis, 4 up to date, 0 needs refresh data," and Search on handles filters the list once you run several sets.
Every scheduled set's card carries the same controls:
- The handles in the set and the run date.
- Status badges, SCHEDULED and UP TO DATE.
- View report, which opens the latest run.
- Get a new report with the latest X data and End Scheduling.
- Past Analyses (N), which expands the earlier dated runs.
The run date deserves a habit of its own. It tells you when the data was pulled, and the posts inside the report are older than that, so note both when you quote a figure.
A practical tip for anyone running more than one set: keep a separate set per question. A set of direct rivals and a set of category leaders answer different questions, and mixing them in one card makes the series harder to read.
What a monthly competitor report costs in tokens
A monthly competitor report costs one Competitor Token per competitor per report, and your own account is always free. That makes the arithmetic short: competitors multiplied by reports.
The number people miss is the report count. A 12-month schedule produces 13 reports, because today's report counts along with the 12 that follow.
| Setup | Reports | Tokens |
|---|---|---|
| Your account + 4 competitors, once | 1 | 4 |
| 5 competitors, once | 1 | 5 |
| Your account + 3 competitors, 12 months | 13 | 39 |
| Your account + 4 competitors, 12 months | 13 | 52 |
| 5 competitors, 12 months | 13 | 65 |
Leaving yourself out of a 12-month set adds 13 tokens and one more peer.
That trade is worth it only when you do not need to appear in the comparison, such as a category study or a report on a client you are pitching.
Check your balance and token options on Circleboom Twitter plans and pricing before you pick a long schedule. A shorter MONTHS value lowers the report count, and the screen shows the total before you commit.
Should an X competitor report run monthly or by hand?
A monthly schedule is better when the report feeds a recurring review, and a manual re-run is better for an occasional check. Both produce the same kind of dated result.
The difference shows up over time. A manual series depends on memory, so the gaps land where you were busy, and those are often the months you most wanted to explain later.
A scheduled set re-pulls itself on the chosen day without any action from you.
Monthly dated reports also make trends visible in a way a one-off cannot. Six months of runs show the month a competitor accelerated, so you can check what changed in that month.
Roundups of the best apps to accurately monitor your Twitter analytics rarely mention this, and the history only exists if someone started collecting it earlier.
Manual re-runs still have a job. Get a new report with the latest X data gives you a set's fresh run on any day, which suits a set you only check now and then.
How to turn the monthly report into a presentation
Create Branded Presentation builds a brandable, logo-carrying export from the current report, ready for an executive summary or a monthly reporting deck.
Open the latest run with View report and start from there.
Before exporting, decide which single gap the presentation is about.
The workflow I recommend runs in this order:
- Read Audience Quality before trusting any follower count.
- Find the largest gap you can act on.
- Connect that gap to one action, such as a scheduling change or a format test.
Show the evidence that belongs to that action and keep the account set, dates and sample context in view. A timing recommendation needs the audience activity and the posting alignment, and very little else.
The X competitor report sample shows what you are working with. It is a sample report on public accounts, comparing Visa, Mastercard, PayPal and American Express.
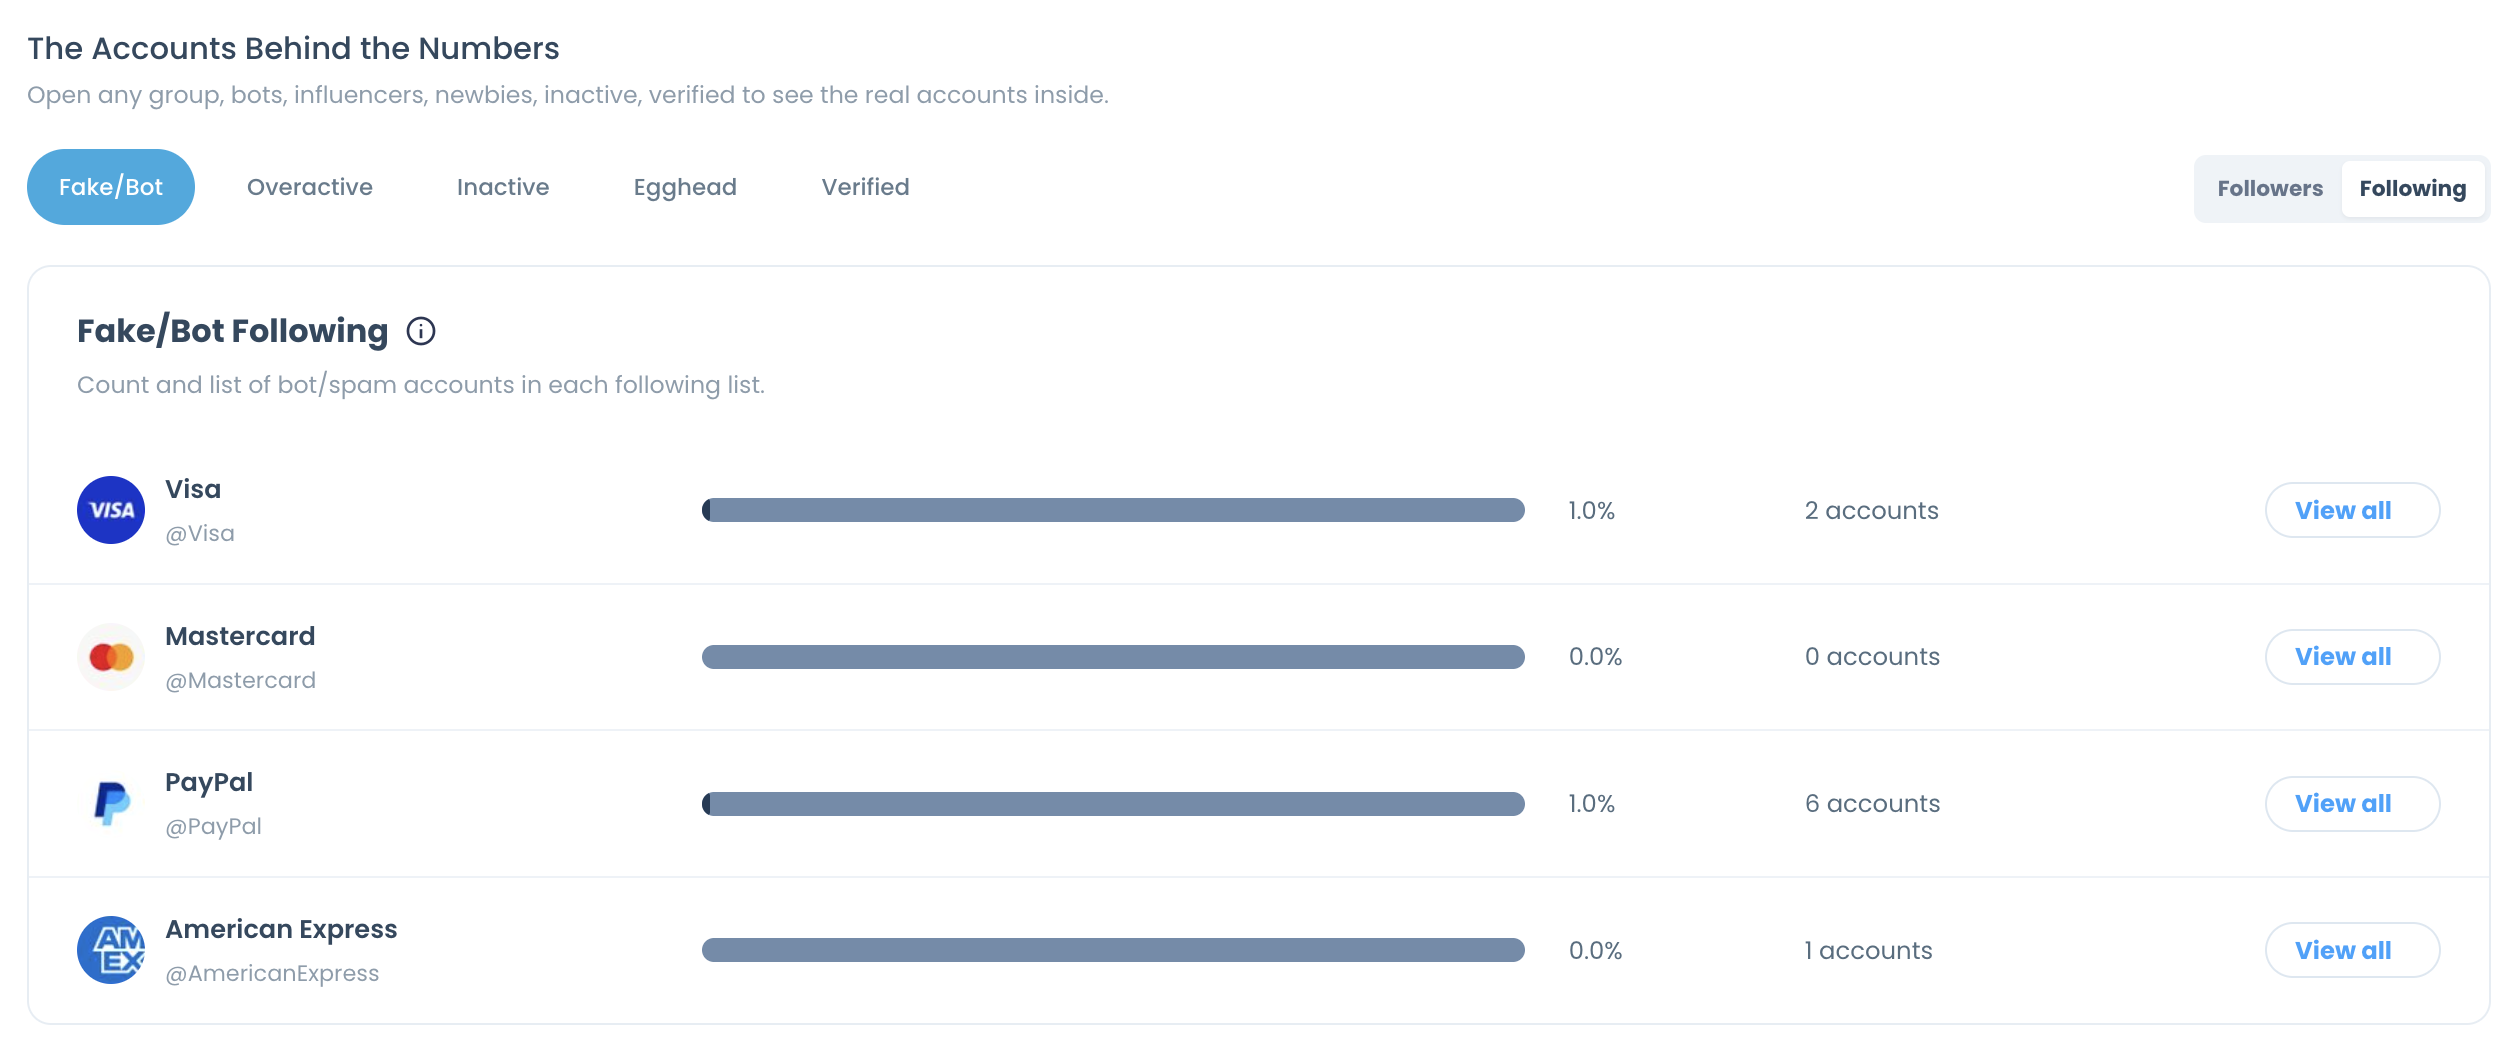
Panels like this one work well as a backup slide, since a list of flagged accounts behind a percentage is easier to defend than the percentage alone. They remain signals for review and never a verdict on any account.
If your stakeholders want the underlying figures in their own format, this walkthrough on how to export Twitter analytics covers it.
When your own X numbers are all you need
Some months the question has no rival in it. For your own account's progress, use the Twitter account analysis report rather than a benchmark.
Those numbers can go into your deck too, through the Twitter analytics export.
If the native dashboard is the blocker, Twitter analytics not working lists the usual fixes.
For a wider view of what the own-account side covers, see Circleboom's advanced Twitter user analytics.
Your monthly Twitter report checklist
Run this list once and the schedule takes care of itself. I keep it this short on purpose, because the settings matter less than the discipline around them.
- Write down the 3 to 5 direct peers and why each one qualifies.
- Decide whether your own account takes a slot.
- Multiply competitors by reports, remembering that 12 months is 13 reports.
- Set MONTHS and FIRST MONTHLY REPORT ON to fit your reporting date.
- Open each new run in the Monitoring menu and pick one gap and one action.
The mistake I see most often is reading the first report closely and never opening the fourth.
A series only pays off when someone compares the runs.
Because each run is a dated record pulled by an official X Enterprise Developer, the series holds up when someone asks where a number came from.
→ Create your monthly competitor report on X now
Monthly schedule FAQ: tokens, dates and stopping
How do I stop or end a monthly schedule?
Press End Scheduling on the set's card under Your saved analysis in Circleboom, and the automatic monthly runs stop. You can do this at any time before the selected months run out, and the set's earlier runs stay under Past Analyses.
Why did a number change between two monthly reports?
Each X run refreshes a rolling sample of up to about 3,200 recent tweets per account, so an average can move because of new posts, older posts leaving the sample, or later interactions on retained posts. Check the post dates and the per-post averages before crediting a strategy decision.
Can I run one more X report right after a campaign ends?
Yes. Press Get a new report with the latest X data on the set's card, and Circleboom adds a new dated run. Tokens are charged per competitor per report, so count that extra run in your balance.