
Per post: X shows you one tweet's likes when you open it. Circleboom: ranks your whole post history by likes, impressions, replies, or engagement rate through official X Enterprise APIs, so the top performers surface without opening anything.
→ check how many likes your tweets got
The missing feature is not the number. It is the sort.
X will tell you how many likes any single tweet received. What it will not do is rank your posts against each other, which is the thing you actually wanted when you started counting.
The gap is sorting, not measuring
Every post carries its like count. Open a tweet, the number is there. Open the analytics view for it, more numbers are there.
The problem is that this is per-post. Answering "which of my tweets got the most likes" through that interface means opening posts one at a time and holding a running maximum in your head, which is feasible across thirty posts and absurd across three thousand.
X's summary view covers a recent window, typically the last 28 days. Useful for a monthly check, useless for the all-time question, because your best post is statistically unlikely to have happened in the last four weeks.
So the honest description of the gap is narrow and specific. The data exists and is visible. What is missing is a sortable table across the full history.
You are not missing a metric. You are missing a sort column.
That distinction changes what to look for. Anything promising to reveal hidden like counts is describing a problem you do not have.
What you want is a table. Somewhere you can rank your tweets by likes in one click and stop reconstructing the answer by memory.
The premium question comes up constantly here, and the answer is less restrictive than people assume. How to check analytics on Twitter without premium covers what is reachable without a subscription.
For the reach half of the same table, Circleboom's impression analytics view sorts on the denominator rather than the numerator.
For the neighboring question about totals rather than rankings, how can I see my total impressions on Twitter covers the aggregate view.
What a ranked history actually shows
Sorting the full post history by likes produces something a per-post view cannot: a distribution.
The first thing most people notice is how skewed it is. Engagement on X follows a steep curve, so a small number of posts account for a disproportionate share of total likes, and the drop from the top post to the tenth is usually much larger than expected.
That shape has a practical consequence. Your average like count is a nearly meaningless number, because it is dragged upward by a handful of outliers. The median is the honest figure for what a typical post does, and the two are often different by a factor of five or more.
The second thing that surfaces is which posts you had forgotten. Almost everyone has a post from two years ago sitting in their top five that they cannot recall writing. It is frequently the most informative row in the table, because it succeeded without any of the deliberate effort that went into the posts you do remember.
Circleboom presents each post as a row with its impressions, likes, reposts, replies, bookmarks, profile clicks, and link clicks, with any column available as the sort key.
If ranking is the whole task, how to see the most liked tweet of someone covers that specific operation.
Likes are the weakest signal on the row
Having established that you can rank by likes, the more useful point is that you often should not.
A like is the cheapest action available. It costs nothing, commits to nothing, and correlates loosely with whether anyone read past the first line. That makes it a reasonable popularity proxy and a poor quality signal.
The columns that carry more information:
- Engagement rate, which is engagements divided by impressions, and normalizes for reach.
- Replies, which cost real effort and indicate something worth responding to.
- Bookmarks, the strongest signal on the row, because someone saved it to return to.
- Profile clicks, which show the post made someone curious about you rather than just the post.
Sorting by likes and sorting by bookmarks produce noticeably different top tens on most accounts. The like list skews toward posts that were agreeable. The bookmark list skews toward posts that were useful, and the second is a far better guide to what to write more of.
Raw counts also hide the reach question entirely. A post with 400 likes on 200,000 impressions performed worse than a post with 90 likes on 8,000, and only engagement rate makes that visible.
X's own guidance on liking posts sets out what the action means on the platform, which is worth knowing before you build a content strategy on it.
How to check how many likes your tweets got
To check how many likes your tweets got across your history, log in to Circleboom, open Post Analytics, load your post history into the engagement table, then sort by the likes column to rank every post from highest to lowest. Switching the sort column re-ranks the same set, which is where the comparison becomes useful.
Five actions, ending with the comparison rather than the count.
Load the full post history
- Log in to Circleboom Twitter and connect the X account you want to measure.

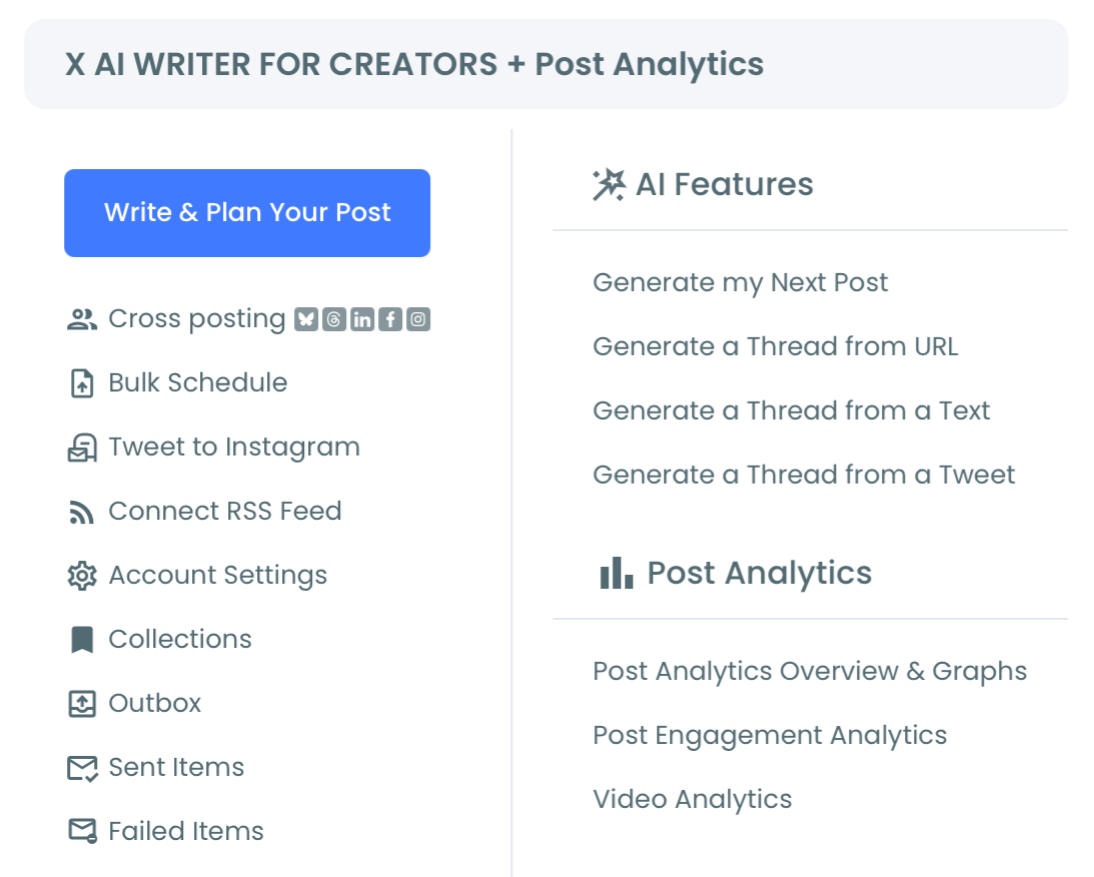
- Open Post Analytics and let the engagement table load your accessible post history.
Sort, then compare sorts
- Sort by the likes column, descending. The all-time most-liked posts surface immediately, with no post-by-post checking.
- Re-sort by engagement rate to see which posts performed best relative to the audience that actually saw them. Expect a different top ten.
- Re-sort by bookmarks and replies to find the posts people saved or felt compelled to answer, which is usually the most actionable list of the three.
That sequence works because the ranking is only half the value. One sort tells you what was popular; three sorts tell you the difference between popular, efficient, and genuinely useful, and the gap between those lists is where the insight lives.
At a glance: sort by likes for popularity, engagement rate for efficiency, bookmarks for utility.
One boundary worth knowing upfront. The table covers the accessible window of roughly your most recent 3,200 posts, and metrics are captured at load time rather than streaming live.
Short demo: how one post history sorts by likes, then re-sorts to reveal a completely different set of top performers.
Turning the ranking into something you use
A ranked list is only interesting once. The value comes from what you extract from it.
Read your top twenty posts as a set rather than individually, and look for what they share. Not the topic, which is usually obvious and unhelpful, but the structural properties: how they opened, how long they were, whether they asked something, whether they carried media, what time they went out.
Then do the same for the bottom twenty from the same period. The contrast is more informative than the top list alone, because a pattern that appears in both is not what made the difference.
What usually emerges is narrower than expected. Most accounts have two or three formats that reliably work, and the winners are the same formats executed on a topic that happened to land.
The other use is reuse. A post that performed two years ago has an audience that has largely turned over since, and a substantial share of your current followers have never seen it. Your ranked list is a content calendar you already wrote.
For the systematic version of this, what to tweet based on past analytics turns the ranking into a planning input.
Compare against yourself, not against anyone else
The like count that tells you the least is somebody else's.
Engagement scales with audience size, topic, and posting frequency, none of which are constant between two accounts. A post with 2,000 likes from an account with 400,000 followers is a weaker result than 60 likes from an account with 900, and comparing the raw numbers gets that backwards every time.
The comparison that carries information is against your own history. Your median is the baseline, and a post is good or bad relative to what your posts normally do.
Three baselines worth knowing
Pull these once and they make every subsequent number interpretable:
- Your median likes per post, which is your normal.
- Your median engagement rate, which normalizes for reach.
- The gap between your top post and your tenth, which tells you how outlier-dependent your account is.
That third number is the one people never calculate and the most useful of the three. A steep gap means your results ride on rare breakouts, so consistency in posting matters more than optimizing any individual post. A shallow gap means your format works reliably, and the growth lever is volume or reach rather than quality.
Recalculate quarterly rather than continuously. Engagement drifts with audience composition, and a baseline from two years ago describes an account you no longer have.
The trap to avoid is benchmarking against published industry averages. They aggregate across account sizes, niches, and posting patterns so different from yours that the resulting number describes nobody, and certainly not you.
Your median is the only benchmark that knows anything about your account.
For the engagement-rate side specifically, how to improve your Twitter engagement rates works through what actually moves the ratio.
Where the numbers stop being trustworthy
Circleboom is an official X Enterprise Developer company, so the metrics come through authorized API access rather than scraping or estimation. The constraints are real and worth naming.
The 3,200-post window applies here as it does everywhere. For a long-running account, the all-time ranking is an all-time-recent ranking, and a genuinely old top performer may sit outside it.
Metrics are also snapshots from load time. A post published this morning is still accumulating, and comparing it against a two-year-old post ranks a partial result against a finished one.
Give recent posts time before judging them:
- A day covers the bulk of engagement for most posts.
- A week captures nearly all of it.
- Anything under a few hours is noise.
There is also a deeper limit. Likes measure what an audience rewarded, which is not the same as what served your goals, and an account optimizing purely for the like column drifts toward agreeable content that converts nothing.
For a fuller picture of how the metrics relate, tweet activity and Twitter analytics metrics is a good reference.
Rank it, then read the difference
Checking how many likes your tweets got is a sorting problem, and it resolves the moment your history sits in a table you can order by any column.
Sort by likes for the answer you came for. Then sort by engagement rate and bookmarks, and pay attention to the posts that move.
→ open your X engagement analytics
Questions about tweet like counts
Can I see all-time most-liked tweets on X?
Not natively. X shows per-post numbers and a recent summary, so ranking the full history requires a sortable table across your accessible posts.
Why is my average like count misleading?
Engagement is heavily skewed. A few outliers drag the average well above what a typical post achieves, so the median describes your normal performance better.
How far back does the ranking go?
Roughly your most recent 3,200 posts, which is the standard API window. Anything older sits outside the accessible range.
Should I optimize for likes?
Only partly. Bookmarks and replies indicate usefulness and genuine interest, while likes mostly indicate agreement, so the bookmark ranking is usually the better guide.
Are the numbers live?
No. They are captured when the table loads, so a post from this morning is still accumulating and is not comparable to an older one yet.