

What does a competitor's average likes per tweet tell you, and what does it leave out? It tells you how many likes one of their typical posts earns, on a stated date, and it says nothing yet about who liked or why.
What a competitor's likes number gives you.A per-post average for each account, read from one column.A monthly likes total, which rises with posting volume.No list of who liked, and no proof of buying intent.
Built on Circleboom's benchmark report, which calculates likes per post for up to 5 X accounts through official X Enterprise APIs. Start with average likes per tweet.
What a likes figure on X shows and what it does not
A likes figure on X comes in four forms, and each one answers a different question. Most confusion about a competitor's likes starts when one form is quoted as if it were another.
| Likes figure | What it shows | What it does not show | Where it is found |
|---|---|---|---|
| Per-post average | How many likes a typical post from the account earns | Which posts earned them | AVG LIKES column, Engagement summary table |
| Monthly total | How many likes the account collected in a month | Whether single posts did well | Likes tab of the over-time chart |
| Likes per follower | Likes set against audience size | How many people saw the post | Not a report metric; divide AVG LIKES by FOLLOWER yourself |
| Who liked | The accounts behind the count | Anything about the average | Not in the report at all |
The per-post average, the average likes per tweet, is the one to compare across accounts. A monthly total moves with how often an account publishes, so two accounts with the same average can post very different totals.
An illustrative gap: 300 likes against 50
Here is the illustrative case Circleboom's own documentation uses. A competitor averages 300 likes per tweet and you average 50.
That gap is real information about how posts land, and it still contains no instruction. The documented next move is to study the opening lines of the competitor's most-liked tweets, because those show which hooks work in the niche.
A likes average measures the response. It does not explain the response.
Circleboom compares the likes average for each competitor on X in one table. The first row of the table above becomes a number you read and do not build.
What a single like stands for
A like records that someone responded, and nothing more specific than that. Circleboom's documentation is plain about the limit: a higher likes figure is no evidence that people intend to buy, and it carries no reason for the response.
Other interactions sit in separate columns of the same table and describe other outcomes, such as discussion or sharing. Read each against the goal you have for the account instead of adding them to the likes figure in your head.
Where a competitor's average likes per tweet comes from on Twitter
A competitor's average likes per tweet comes from Circleboom's X Competitor Analysis and Benchmark Report, which retrieves up to about 3,200 recent tweets per account and calculates a per-post likes average from them. Every account in the comparison gets the same calculation on the same date.
Circleboom is a verified Enterprise partner of X, which is why the like counts behind the average are X's own records. Scraping-based collection can miss posts, and a missed post changes an average without leaving any sign that it did.
That is the practical difference from a hand count. With Circleboom you read each rival's average likes per tweet calculated on one basis for every account, where a manual tally uses whichever posts happened to be visible.
Which accounts go into the comparison
The comparison holds up to 5 public X accounts in total. Your own account is optional: you can add it with up to 4 competitors, or enter up to 5 accounts that are not yours.
After you log in to Circleboom Twitter, the report is the first item under Monitoring. Handles go into the Account Handles panel, one per input, and a counter tracks how many of the 5 slots are filled.
Choose peers with care, because the set defines what a good number means. Direct peers share your market and your account scale. Category leaders are useful for studying approaches, and their raw figures make poor targets.
How the run starts and what it costs
The run starts from the Start Competitor Analysis button, followed by a choice between a single report and a monthly schedule. The cost is displayed in Competitor Tokens before any data is pulled, as competitors multiplied by reports.
Each finished run carries its date and stays in your saved list. A later run of the same accounts produces a new dated result and leaves the earlier one in place, which is what makes a before-and-after reading possible.
Where likes appear once the report opens
Likes appear in two places in the Engagement section. The Engagement summary table lists AVG LIKES per account, and the over-time chart has a Likes tab that plots totals month by month.
The table's own caption states that every metric in it is an average per tweet. The chart is the volume view. Quote the first when the question is about posts and the second when the question is about a month.
If you only need a quick public read on a single account, with no comparison set, Circleboom's free metrics calculator for Twitter and X is the lighter route.
Why a platform-wide likes average is no benchmark for your X account
A platform-wide average is no benchmark because engagement on the platform is spread too unevenly for a single middle value to describe anyone. The figure exists, and it describes nobody in particular.
Pew Research Center's 2021 study of U.S. adults on Twitter shows the shape. The relevant chapter is the one comparing highly active and less active tweeters. It looks at the top 25% of U.S. adult users by tweet volume, the group that wrote the overwhelming majority of tweets in the study period.
In a typical month, the posts of those high-volume users collectively received an average of 37 likes and one retweet.
Pew's own chart title states the conclusion: most U.S. adults on Twitter receive relatively few likes and retweets, whatever their tweet volume. A brand account or an established creator sits far from that middle.
X does not publish an official likes benchmark by account size or by niche. In my experience, anyone quoting one is quoting a third party's sample. The defensible comparison is the one you can name: these accounts, this date, this source.
Can you see who liked a competitor's posts on X?
Not through the benchmark report. The report reads how many likes each post received and contains no list of the accounts behind them.
The count and the list are separate things in X's own developer documentation. Its Likes lookup page describes two requests: one returns the users who liked a given post, and the other returns the posts a given user has liked.
That page also separates public data from private metrics, with a different kind of access token for each. It is developer documentation, and it does not describe what a visitor sees on a profile.
For the question in this article, the split settles the matter. The average likes per tweet is built from counts, so it never needed the list. A competitor's average likes per tweet is the same figure whether or not anyone can see the names behind each heart.
Why the liker list would not improve the average
A list of likers answers an audience question, and the average likes per post answers a content question. Knowing which accounts liked a rival's post would tell you about their followers. It would not change how many likes their typical post earns.
When the audience is what you care about, the report's Audience Quality section is the relevant read. It classifies each account's followers as a group and stays away from who tapped what.
Is likes per follower a better measure than likes per post on Twitter?
No. Average likes per tweet is the better comparison measure, and likes per follower is a secondary check you calculate yourself.
The report has no likes-per-follower column and no follower-to-following ratio metric. What it gives you is the FOLLOWER count next to AVG LIKES in the same row, so the division takes a moment when you want it.
The reason to keep it secondary is that followers are a weak denominator. A follower count is cumulative and includes accounts that went quiet long ago. Two accounts with equal followers can have very different numbers of people who could respond to a post.
The report's engagement rate avoids that problem by using a different base. It is total engagement divided by total impressions, which describes how often people who were shown a post interacted with it. Do not read it as a follower-normalized rate.
What counts as a good likes number for your account size
A good number is one that holds up against direct peers, because no official scale exists. Pick accounts that share your market, language and scale, and read your AVG LIKES in the same table as theirs.
Size cuts both ways here. A larger rival often collects more likes per post, and the size gap is the very thing a per-post average and an impressions-based rate help you see past. A smaller peer that out-earns you per post is the more useful warning.
Which posts sit behind a competitor's likes average on X?
The posts behind an average are in the report's Content Leaderboards section, which lists each account's top 5 tweets by engagement in side-by-side columns. Engagement there is the combined interaction count, so the list is close to a most-liked ranking without being one.
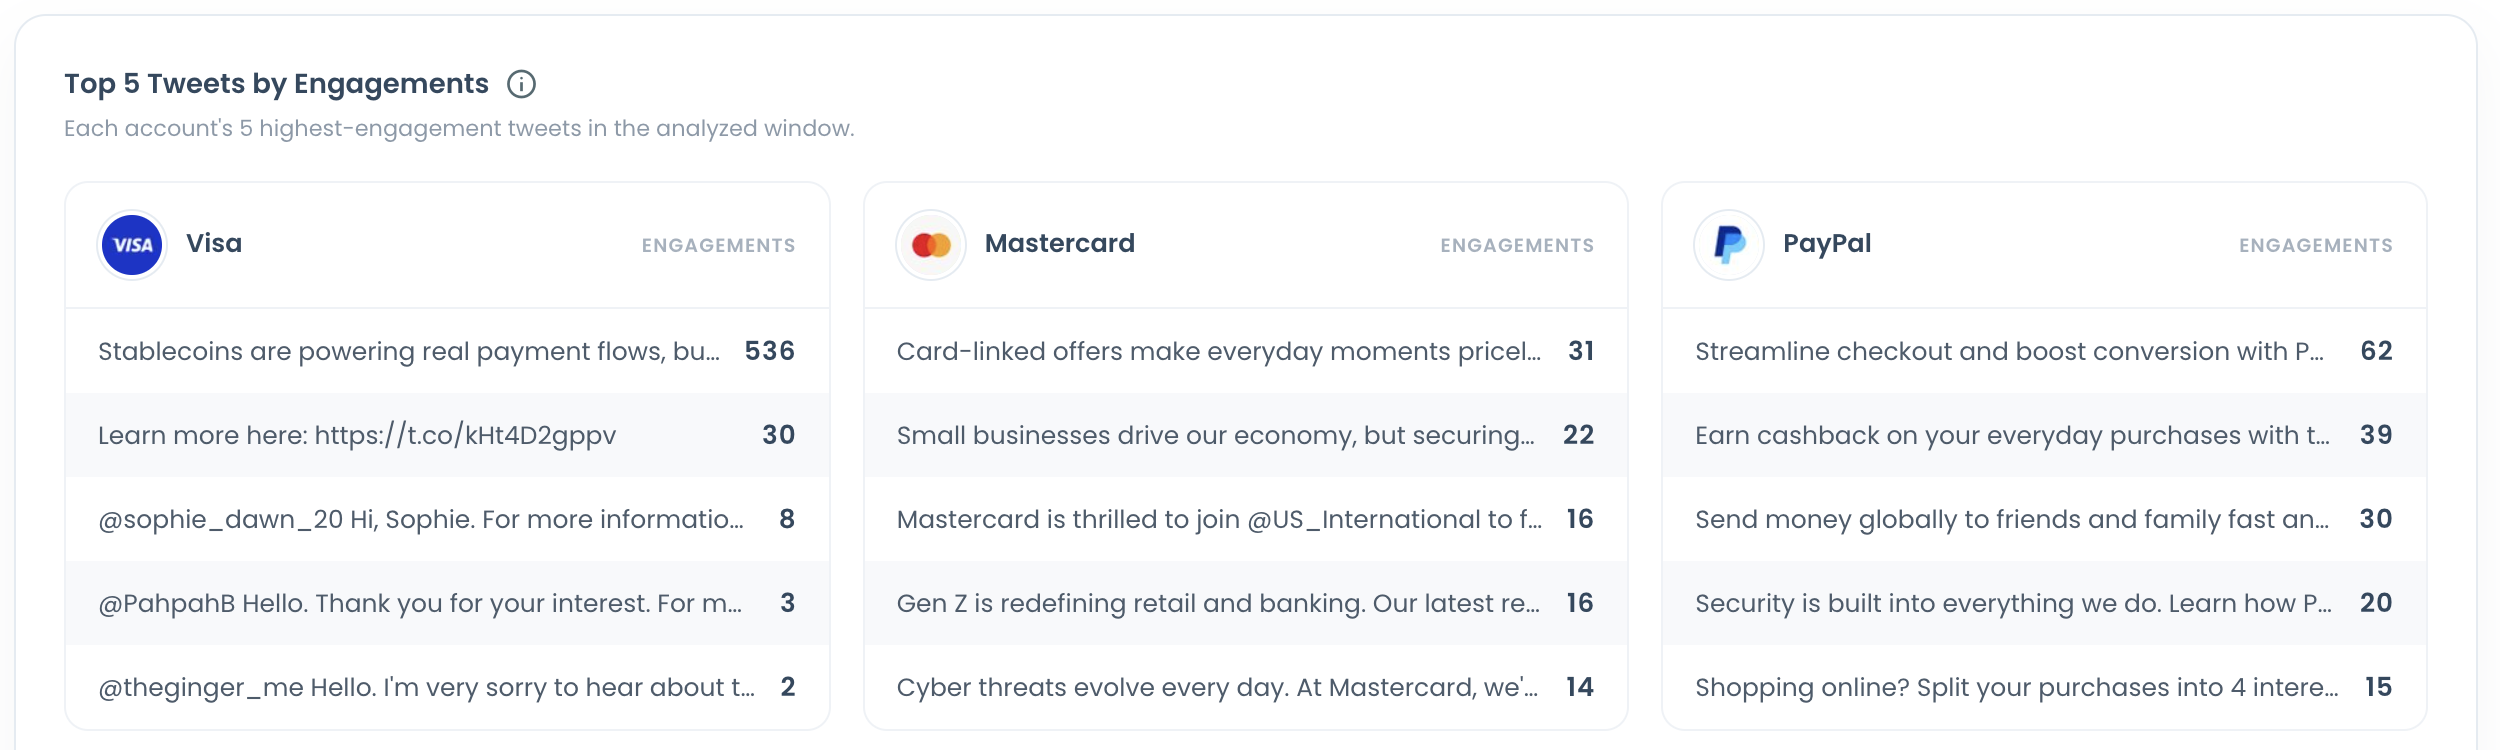
Read that panel before you trust any average likes per tweet figure. In the documented sample report, which was run on public brand accounts, impression leaders and engagement leaders were often different posts.
The under-performers panel showed the opposite end, and it is relative to each account: one account's weakest post drew many times the engagement of another account's weakest post.
The panel stops at five posts per account and ranks them by combined engagement. A full timeline pulled into a file supports far more than a ranking. One of our own write-ups comes from an author who exported and analyzed Elon Musk's tweets. It is an example of treating an export as a dataset.
What to write after reading a competitor's most-liked posts
Take the theme and leave the wording. If a rival's best-liked posts keep returning to one theme, the audience you share has shown an appetite for it, and your version should come from your own experience.
For the writing step: how a tweet you admire becomes a starting point for an original one of your own.
What to do on X when your own likes per post run lower
When your own likes per post run lower than a competitor's, compare the kinds of posts before you compare the numbers. A lower figure has several possible causes, and each one calls for a different fix.
The benchmark documentation sets out the order of checks:
- Audience first: a follower base with many inactive accounts cannot respond, whatever you publish.
- Output second: see whether your posting cadence changed in the last 30 days.
- Format and topic third: put your top posts beside theirs and see whether they are the same kind of post.
- Timing last: check whether you publish when your audience is active.
The common wrong turn is skipping straight to volume. Posting more raises the monthly total and leaves the average likes per tweet where it was, or lowers it.
What to do with your own weakest posts
Your weakest posts deserve a look too. The same documentation notes that an account's own zero-engagement tweets can be removed with the delete tools. Anyone who chooses that route can follow the walkthrough on how to delete tweets with fewer or no likes.
Treat removal as housekeeping. It tidies what a visitor sees on your timeline, and it teaches you nothing about why the strong posts worked.
A second dated run closes the loop. Put the same accounts on the monthly schedule and read the average likes per tweet again next month. A change that shows in the per-post average, and not only in the monthly total, is the one worth reporting.
What a competitor's likes average on Twitter is worth
A competitor's average likes per tweet is the most honest single number you can hold about how their posts land, and it is worth exactly as much as the posts you read after seeing it.
→ Check the likes average of your competitors on X
Questions a likes average cannot answer alone
Which exact posts of a competitor got the most likes?
The report has no ranking by likes alone, so the strict order comes from a file. Use Circleboom's tweet export on the competitor's public X timeline and sort by the likes column. Circleboom's blog also covers the wider subject of most liked tweets on Twitter.
Where do I find my own most-liked posts on X?
In Circleboom's engagement analytics for tweets, which sorts the posts of the X account you own by interaction. Open it and compare your top posts by likes with the competitor's top posts for topic and opening line.
Should I delete my low-like posts to raise my average?
I would not do it for the number. Deleting weak posts changes what visitors see on your X timeline, and Circleboom has a walkthrough on how to mass delete tweets based on popularity. The lesson that raises future likes sits in your strongest posts.
How far back does the likes average look?
Circleboom retrieves up to about 3,200 recent tweets per X account, which is not full account history. The same number of posts covers a shorter period for a frequent publisher and a longer one for an occasional publisher, so check the post dates before comparing two accounts.
Can I check a competitor with millions of followers?
Only up to a limit. Circleboom cannot analyze X accounts with more than 3,000,000 followers, and only public accounts can be compared. The cap applies to every account in the set, including your own.

